--%>

Effect on total revenue by raises price

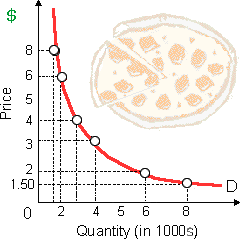
A price raise from $6 to $8 would effect in: (1) a decrease in total revenue. (2) an increase in total revenue. (3) no change in total revenue. (4) consumers buying more pizza. (5) pizza parlors selling more pizza.

1167_pizza budgets graph.png

Please choose the right answer from above...I want your suggestion for the same.

   Related Questions in Microeconomics

  • Q : Attribute Demand Curve for Bonds A

    A demand curve for bonds moving to the right is probably to be attributable to: (w) a business cycle recession. (x) lower expected (future) interest rates. (y) an increase into the expected rate of inflation. (z) an increase in the liquidity of altern

  • Q : Buying low price-riskless selling at

    Buying low within one market and riskless selling at a higher price into another is termed as: (1) speculation. (2) arbitrage. (3) capitalization. (4) marketeering. (5) profiteering. Please choose the right answer from above...I wa

  • Q : Equilibrium market price In a perfectly

    In a perfectly competitive market, market demand curve is provided by Qd = 200 − 5Pd, and the market supply curve is provided by Qd = 35Ps. a) Determine the equilibrium market price

  • Q : Equilibrium price of a quantity I have

    I have a problem in economics on Equilibrium price of a quantity. Please help me in the following question. The equilibrium price is a price at which the quantity: (1) Bought equivalents the quantity sold. (2) Demanded equivalents the quantity supplie

  • Q : Problem on Dynamics When drought causes

    When drought causes ranchers to in advance take cattle to the market, one short-run tendency will be for: (1) The demand for beef to rise. (2) Restaurants to experience shortages of the steak. (3) Prices for pork and lamb to decline. (4) Corn and wheat to become less

  • Q : Describe inferior goods in economics

    Inferior goods in economics: Inferior goods refer to such goods whose demand reduces with the rise in income of consumer.

  • Q : Supply of labor at different wage rates

    The time people are willing and capable to work at different wage rates throughout a given period is termed as the: (1) supply of labor. (2) labor force participation rate. (3) marginal product of labor. (4) labor theory of value.

    Q : Best illustration of an oligopoly The

    The best illustration of an oligopoly is: (1) guaranteed next-day delivery of packages and mail. (2) cranberry production. (3) all the local electric utility companies in New England. (4) the United Autoworkers [UAW] union. (5) Wal-Mart.

  • Q : Gini Coefficient in Loren Curve A Gini

    A Gini coefficient for this demonstrated figure can be computed as: (w) area A minus area B. (x) area A × area B.  (y) area C minus [area A + area B]. (z) [area A] / [area A + area B].

    Q : Competition from poor substitutes A

    A firm in an industry which is a pure monopoly faces as: (w) many competitors from into the industry. (x) competition from only poor substitutes produced in other industries. (y) a market demand curve which is horizontal. (z) prosecution when it impor