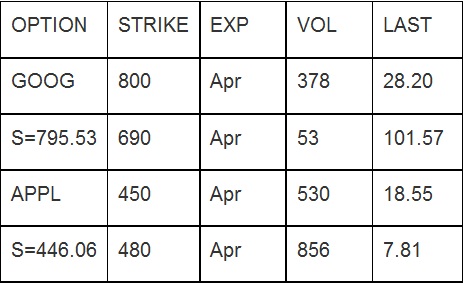
Provide Answer of the following questions given the following call option prices on Google (GOOG) and on Apple (APPL).
Note that these are actual option prices on 2/21/13 and these contracts have 60 days until expiration. The 2-month T-bill rate is about 4.75%. Attach all work with your appropriate report.
Part One:
1. Estimate the theoretical option values for the call on GOOG with K =800 and for the call on APPL with K = 450 by using the Black-Scholes-Merton and Binomial Models program. You can also use the following website to evaluate the option prices and implied volatility www.option-price.com
2. When estimating the option values suppose various standard deviations of returns of 10%, 15%, 20%, up to 100% or till you find the theoretical option value is close to the actual one.
3. Draw a graph showing the relationship between option values and standard deviations.
4. Based on the graph, what does the actual option value imply about the anticipated future standard deviation (volatility)? Which option has higher implied volatility and is it surprising?
Part Two:
1. Estimate the historical standard deviation of the GOOG*.
2. Compare the implied standard deviation with the historical standard deviation.
3. What can you infer from the difference, if any, between the two numbers?
Part three:
1. Evaluate the implied volatility for all options.
2. Do you have the same implied volatility for the two options on the same underlying? What may be capable to explain the differences?