"CONSULTING PROJECT
Production Decisions at Harding Silicon Enterprises, Inc. Harding Silicon Enterprises, Inc. produces less than 1% of the world’s supply of 32 MB random access memory (RAM) chips for electronic devices. HSE’s RAM chips perform according to globally accepted performance standards for this type of silicon chip (i.e., its chips are just like every other producers’chips). HSE has hired you to do undertake three tasks:
1. Perform a statistical analysis of its short-run production costs to estimate its total variable cost function, average variable cost function, and marginal cost function. HSE believes its total fixed costs will be $6,500 per month, so you do not need to estimate TFC.
2. Recommend production levels and forecast profits for two chip price scenarios:
a. The price of 32 MB RAM chips reaches $62 per chip, and
b. The price of 32 MB RAM chips falls to $35 per chip.
3. Determine the price below which HSE should shut down operations in the short run. HSE provides you with the following cost and output data for the past 19 months. Over this time period, inflation has been so low that you do not need to adjust the cost data for the effects of inflation (the CPI rose only 0.4% over the 19 month time period). Monthly output of chips is given in the second column, which is titled “Monthly production of finished product.” Costs are reported in seven categories (some are fixed costs and some are variable costs). HINT: Remember, cost items are part of fixed costs if the costs do not vary with output, even though fixed cost items may vary over time.
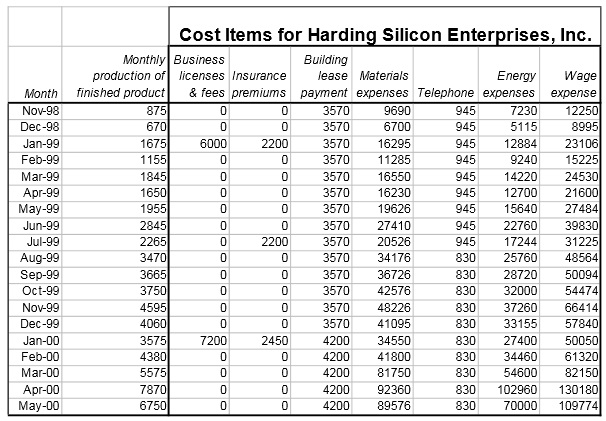
Cost Items for Harding Silicon Enterprises, Inc.
1. a. Compute total variable cost (TVC) by adding the appropriate columns of cost items.
Compute average variable cost (AVC). [Remember that you are given an estimate of HSE’s future total fixed costs ($6,500 per month).] Print out the 19 months of data on output (Q) and total variable cost (TVC) and average variable cost (AVC).
b. Plot a scatter diagram of TVC on the vertical axis and Q on the horizontal axis. Does the scatter diagram suggest a functional form for TVC? Explain briefly.
c. Plot a scatter diagram of AVC on the vertical axis and Q on the horizontal axis. Does the scatter diagram suggest a functional form for AVC? Explain briefly.
d. Estimate a quadratic AVC function. Present the estimated equation and evaluate the regression results (i.e., discuss the algebraic signs of the parameter estimates, the significance levels, and the R2).
e. Evaluate the results of your regression equation in part a. Specifically discuss algebraic signs of parameters, statistical significance, and goodness of fit.
2. a. How many chips should be produced (monthly) if world chip prices are $62 per chip? Forecast the HSE’s profit at this output level.
b. How many chips should be produced (monthly) if world chip prices are $35 per chip? Forecast the profit at this output level.
3. At what price should Harding shut down and produce no chips in the short run?"