Question1) Imagine that the sample of 400 rental units shows that (i) distribution of rents paid per month is not described by a normal distribution, (ii) the mean rent of the sample is $755, and (iii) standard deviation of the sample is $100.
a) Without seeing distribution, can you compute the probability that the rent of a randomly selected unit will be greater than $800? If yes, compute the probability; if no, explain.
b) Without seeing the distribution, can you compute the probability that the mean rent of another sample of 400 units will be greater than $800? If yes, calculate the probability; if no, explain.
c) Why is the answer to (b) only an estimate? (What two numbers about whole population are you not sure of?)
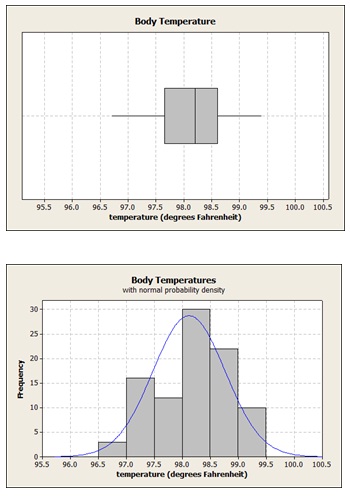
Question2) Study done at the University of Maryland (cited in Weiss, Introductory Statistics, 7th ed, 2005) measured the body temperatures of 93 healthy humans. On the frequency- histogram below, I have superimposed a normal probability-density curve using the sample’s mean and standard deviation (98.12oF and 0.6468oF respectively)
a) Construct a 99% confidence interval for the mean temperature of all healthy humans.
b) Interpret your interval in words.
c) Draw this confidence interval in the space between the histogram and the box plot. Indicate both this sample’s mean, and the previously accepted value of 98.6oF.
d) You should now make a decision: the mean human-body- temperature is, or is not, 98.6oF. Which decision do you make? Briefly explain.
Question3) Imagine that you want to construct a 99% confidence interval for the mean body temperature for adult males. You want the interval’s margin of error to be to be 0.1 Fahrenheit degrees. You also happen to know that POPULATION’S standard deviation is 0.63 Fahrenheit degrees. compute the size of the required sample.
Question4) Internal report issued by the marketing manager of a oil-change franchise claims that the mean number of miles between oil changes is for franchise customers is at least 3600 miles. One franchise owner suspects that the mean distance is actually less than 3600 miles. She collects a random sample of 10 customers, and determines the distance each had driven between oil changes. She finds the following results.
3655 3734 3700 1946 3208
3311 2789 3920 3555 3902
x‾= 3372 s=609
a) Construct a stem-and-leaf diagram.
b) Does your stem-and-leaf diagram in (a) suggest that the distribution of distances is not normal? (For instance, is there any evidence that the distribution is skewed?)
c) Construct TWO 99% confidence intervals.
(i) Use the z-tables.
(ii) Use the t-tables.
d) Interpret your result in (ii) in words.
e) You now should decide: is the mean distance between oil changes 3600 miles, or not? Explain your reasoning.
f) Which (if either) of the confidence intervals in (c) is appropriate? (Suggestion: look at your answer to (b).) Explain briefly.