Question 1
A large shipping company recorded the number of tons shipped weekly across the pacific for 50 weeks. The data is presented in the table below.
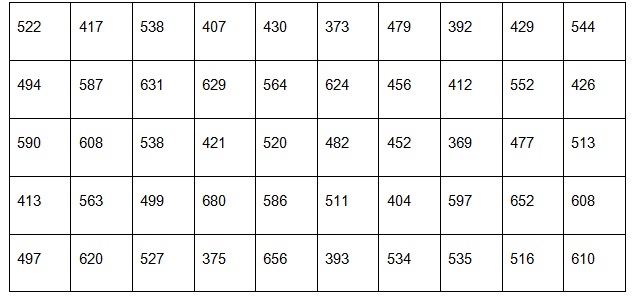
1.1. Arrange the above data in a less-than cumulative distribution using seven classes of equal width.
1.2. Use the distribution in 1.1 to determine the mean, median and mode
1.3. Draw to scale, the less-than o give of the above distribution
1.4. Use the graph drawn in 1.3 to determine:
1.4.1. The 70th percentile
1.4.2. The mid 70% range
Question 2
A company supplies specialized, high tensile pins to a customer. It uses the automatic lathe to produce the pins. Due to factors like vibration, temperature and wear and tear, the lengths of the pins are normally distributed with a mean of 25.30mm and a standard deviation of 0.45mm. The customer will only buy those pins with lengths in the interval 25.00 ±0.50mm.
2.1. What percentage of the pins will be acceptable to the customer?
2.2. In order to improve the percentage accepted, management considers adjusting the population mean and standard deviation of the length of the pins. If the lathe can be adjusted to have any desired mean of the lengths, what should it be adjusted to? Why?
2.3. Assume that the mean (25.30mm) could not be adjusted but the standard deviation could be reduced. Compute the maximum reduction in the standard deviation which will make 85% of the pins acceptable.
2.4. The production manager then considers the costs involved. The cost of resetting the machine to adjust the population mean involves engineering costs and the cost of production time lost. The cost of reducing the population standard deviation involves, in addition to these costs, the cost of overhauling the machine and reengineering the process. Suppose it costs $150x2 to decrease the standard deviation by (x/40)mm.
Find the cost of reducing the standard deviation to the values found in 2.3
Question 3
The resident of a company that manufctures air conditioners is considering switching his suppliers or condensors. SupplieA , the current producer of condensers for the manufacturer, prices its roduct 5% higher than supplier B. Because the president wants to be sure that Supplier B”s condensers last at least as long as suuplier A’s condensers. Afet careful analysis, the president decides to retain supplier A if there is sufficient statistical evidence that supplier A’s condensers last longer, on average that supplier B’s condensers. In an experiment, 15 randomly selected midsize cars were equipped using type A condensers while another 15 randomly selected midsize cars were equipped with type B condensers. The number of kilometres (in thousands) driven by each car before the condenser broke down is displayed in the tabl below
Perform hypothesis test, at 5% significance level, to calculate whether the president must retain supplier A.
Question 4
The quarterly earnings (in$m) of a large soft-drink manufacturer has been recorded for the years 2008-2011
2008 2009 2010 2011
1st quarter 52 57 60 66
2nd quarter 67 75 77 82
3rd quarter 85 80 84 98
4th quarter 54 61 63 67
4.1 Plot a time-graph to represent the above data. What can you deduce from the graph?
4.2 Use the ratio –to moving average method to calculate the adjusted seasonal indices for the four quarters and interpret the results
4.3 Using the zero-sum method, derive the trends line equation representing the above data.
4.4 Get seasonally adjusted trend estimates for the third and fourth quarter of 2012
Question 5
A company is considering whether it should tender for two contracts (C1 and C2) on offer from a government department for the supply of certain components. If tenders are submitted, the companies will have to provide extra facilities, the cost of which will have to be entirely recouped from the contract revenue. The risk, of course is that if the tenders are unsuccessful the company will have to write off the cost of the facilities.
The extra facilities necessary to meet the requirements of the contract C1 would cost $50 000. The facilities will offer enough capacity for the requirements of contract C2 to be met also. In addition the production cost would be $18000. The corresponding production costs for contract C2 would be $10 000.
If a tender is made for C2 only, then the extra facilities can be provided at a cost o only $24000. The production cost would e $12000
It is estimated that the tender preparations costs will be $2000 if tenders are made for contracts C1 or C2 only and $3000 if a tender is made for both contracts C1 ad C2\For each contract, possible tender prices have been determined. In addition, subjective assessments have been made for each probability of getting the contract with a particular tender price as shown below. Note there that the company can only submit one tender and cannot, for expel submit two tenders (at different prices) for the same contract
Possible tender price ($) Prob of Winning Contract)
Tendering for C1 only 120000 0.3
110000 0.85
Tendering for C2 only 70000 0.1
65000 0.6
60000 0.9
Tendering for C1 and C2 190000 0.05
140000 0.65
100000 0.95
In the event that the company tenders for both C1 and C2 it will either win both contracts (at the price shown above) and no contract at all with the aid of a decision tree prepare a report advising the company on the best course of action.
Question 6
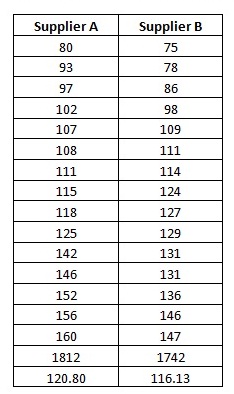
The president of a company that manufactures air conditioners is considering switching his supplier of condensers. Supplier A, the current producer of condensers for the manufacturer, prices its product 5% higher than supplier B does. Because the president wants to maintain his company’s reputation for quality, he wants to be sure that supplier B’s condensers last at least as long as supplier A’s condensers. After careful analysis, the president decided to retain supplier A if there is sufficient statistical evidence that supplier A’s condensers last longer than supplier B’s condensers. In an experiment, 15 randomly selected midsize cars were equipped using A-type condensers while another 15 randomly selected midsize cars were equipped with type B condensers. The number of kilometres (in thousands) driven by each car before the condenser broke down is displayed in the table below
Supplier A Supplier B
156 109
146 75
93 131
152 131
80 129
111 147
107 78
118 124
115 86
125 127
108 111
97 146
142 114
160 136
102 98
Perform a hypothesis test, at 5% significance level, to determine whether the president should retain supplier A.