Shift in the demand for loanable funds

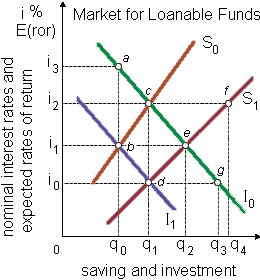
Assume that this market is initially within equilibrium along with a supply of funds consequent to S0 and a demand for loanable funds consequent to I1. When the U.S. Department of the Treasury began selling more bonds to fund a growing federal budget deficit, in this would be probably to cause: (1) a shift in the demand for loanable funds through I1 to I0. (2) the rate of return schedule reflected in I0 to shift to the left. (3) a movement down the saving schedule from point b to point d. (4) a movement in this market by point b to point e. (5) households to reverse their saving plans.

730_Problem on Loanable Funds.png

Can someone explain/help me with best solution about problem of Economics...

   Related Questions in Microeconomics

  • Q : Unitarily elasticity in supply curve At

    At point b, in demonstrated figure the supply curve into this graph is: (w) perfectly elastic. (x) elastic, but not perfectly that why. (y) unitarily elastic. (z) inelastic.

    Q : Area of Loren Curve This function as in

    This function as in illustrated figure area between A and B is termed as a/an: (1) index of inequality. (2) Lorenz curve. (3) Pareto indicator. (4) Gini coefficient. (5) Marx-Engels curve.

    Q : Minimizes average cost of output When a

    When a monopolist maximizes profit and charges a price equivalent to average cost, in that case the firm: (i) is producing at the minimum point on its marginal cost curve. (ii) also charges a price equal to marginal cost. (iii) is pro

  • Q : Marginal Rate of transformation Define?

    Define? Marginal Rate of transformation?? Describe with the help of an illustration.

  • Q : Are you being charged too much for

    This exercise inspects the higher prices charged in UK for music downloads as compared to the rest of Europe.

  • Q : Maximum total revenue for elasticity of

    The elasticity of demand equals one and consumer spending upon Robot Butlers (there is the firm’s total revenue), is at a maximum at a price of as: (1) $20,000. (2) $15,000. (3) $10,000. (4) $5,000. (5) zero.

    Q : Average Product and Marginal Product

    State the relationship among Average Product and Marginal Product? A) If MP > AP, then AP is rising B) If MP = AP, then AP is maximum C) If MP < AP, then AP is falling

  • Q : Problem on deadweight loss Assume that

    Assume that the domestic demand for television sets is explained by Q = 40,000 − 180P and that the supply is provided by Q = 20P. When televisions can be freely imported at a price of $160, then how many televisions would be generated in the domestic market? By

  • Q : Combinations of goods in production

    Points exterior to economy’s production possibilities curve exhibit combinations of goods which: (i) Can’t be produced with the economy’s present capacity. (ii) Employ resources proficiently in production. (iii) Don’t utilize t

  • Q : Economically inefficient level of output

    A monopolist produces an economically inefficient level of output since: (i) the difference among marginal revenue [MR] and marginal costs [marginal costs [MC] is maximized. (ii) P > average total costs [ATC], therefore MSB < MSC. (iii) all cons

©TutorsGlobe All rights reserved 2022-2023.