--%>

Problem on demand curve

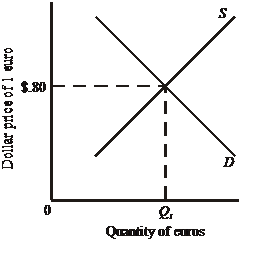
Give me answer of this question. Refer to the following diagram. Other things equal, a rightward shift of the demand curve would: A) depreciate the dollar.  B) appreciate the dollar. C) reduce the equilibrium quantity of euros. D) depreciate the euro.

2466_11.png

   Related Questions in Microeconomics

  • Q : Illustration of monopolistic competition

    A small neighbourhood grocer in a big town mainly close approximates a: (i) pure competitor. (ii) monopolist. (iii) monopolistic competitor. (iv) oligopolist. (v) monogamist. Hello guys I want your advice. Please recommend some vie

  • Q : Profit-maximizing to make economic

    This profit-maximizing brickyard of below illustrated figure on the average is, about: (i) making an economic profit of $8 per thousand bricks. (ii) incurring variable costs of $90 per thousand bricks. (iii) suffering an accounting loss of $2 per thou

  • Q : Monopolistically-competitive market

    When numerous new firms enter a monopolistically-competitive market, in that case the demand curves facing the firms previously in that market will: (1) shift to the left and turn into more price elastic. (2) become straighter and less income elastic.

  • Q : Market price of long-run equilibrium

    When this firm is typical in this purely competitive market, in that case long-run equilibrium for Christmas trees will be reached at a market price is of: (1) P1. (2) P2. (3) P3. (4)

  • Q : Effects when rental price and quantity

    When the rental price of DVDs start from $2.50 to $.99 and the quantity demanded raises from 510 to 820 in that case the price elasticity of demand to rent DVDs is: (w) perfectly elastic. (x) perfectly inelastic. (y) relatively elasti

  • Q : Profit-maximizing price and output

    Unlike a purely competitive firm, a monopolist can: (w) select a price and sell as much as this needs (x) equate marginal revenue as well as marginal cost to maximize profits. (y) produce any required amount and sell as much as this d

  • Q : Compute Gini Index The areas

    The areas illustrates in this Lorenz diagram can be used to compute a Gini index as: (i) (cow + pig)/cow. (ii) cow2/(cow + pig).  (iii) pig2/(cow + pig). (iv) cow/(cow + pig) (v) (cow + horse)/pig.

    Q : Example of temporary housing shortage

    After the change within the demand curve for housing as: (1) a temporary housing shortage may exist at R0. (2) landlords will have more complexity repaying their mortgages. (3) rental rates will fall below interest payments. (4) equilibrium

  • Q : Occurrence of socially optimal

    The socially optimal production of penicillin arises while quantity: (a) Q1 is produced and sold at price P1. (b) Q1 is produced and sold at price P3. (c) Q2 is produced and sold at price P2<

  • Q : Problem on Equilibrium condition

    Reduction in the size of average American family is most probable to: (i) Erode rates of the technological advancement. (ii) Raise the demand for disposable diapers. (iii) Decrease women’s labor force participation rates. (iv) Increase the contribution of family