--%>

Average cost minimization at level of sales and production

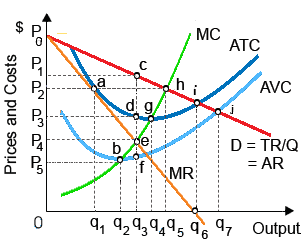
HoloIMAGine has patented a holographic technology which makes 3-D photography obtainable to consumers. There level of sales and production at that HoloIMAGine would minimize its average cost [ATC] of production corresponds to as: (1) point b and output q2. (2) point e and output q3. (3) point g and output q4. (4) point h and output q5. (5) point j and output q7.

1110_Market Power1.png

Hello guys I want your advice. Please recommend some views for above Economics problems.

   Related Questions in Microeconomics

  • Q : Price elasticity of demand When a

    When a monopolist’s marginal costs of production are positive and the demand curve, this faces is a negatively sloped straight line, as of the subsequent possibilities the absolute value of the price elasticity of demand at a pr

  • Q : Monopolistic Exploitation problem Can

    Can someone help me in finding out the right answer from the given options. When a firm hires labor to a point where VMPL > MRPL = MFCL = w, then the (1) Firm consists of monopsony power. (2) Employees of firm are experiencing t

  • Q : Least likely example of Substitution

    Can someone please help me in finding out the accurate answer from the following question. Assume that the War in Iraq spilled over into another oil exporting countries. When U.S. gasoline prices rose to, state, $10 per gallon, the least likely outcome would be that:

  • Q : Bond of fixed annual income A bond

    A bond which pays a fixed annual income always is: (w) an eternity. (x) a perpetuity. (y) worthless. (z) infinitely valuable. Can anybody suggest me the proper explanation for given problem regarding Econom

  • Q : Change in prices after short run demands

    Can someone please help me in finding out the accurate answer from the following question. The changes in gasoline prices do not change short-run demands for (1) Bigger versus smaller cars. (2) Gasoline. (3) Alternative forms of the transportation. (4) Batteries, Tire

  • Q : Consumption of goods changes as income

    This below figure demonstrates how consumption of goods A, B, C and D changes as a family’s income changes. When income increases, the income elasticity of demand is positive although declining for: (w) good A. (x) good B 

  • Q : Illustration of limit pricing strategy

    An illustration of limit pricing strategy occurs while the incumbent firm: (w) sets a price below costs to drive its competitor out of the market. (x) redesigns its product lines to create components incompatible along with rivals. (y) which has a cos

  • Q : Nonlinear kinked demand curve Within

    Within this "kinked-demand curve" model, that firm views the demand curve this faces as the: (w) linear "kinked" demand curve aD2 for all prices. (x) linear "kinked" demand curve D1D1 for all prices. (y) nonlinear "kin

  • Q : Monopolistic Exploitation Can someone

    Can someone help me in finding out the right answer from the given options. In the equilibrium for a price maker firm, the rate of monopolistic exploitation is any difference among: (i) P and MR. (ii) P and MC. (iii) VMP and MRP. (iv) Output price and rate of monopson

  • Q : Characteristics of Labor-Leisure

    Can someone help me in finding out the right answer from the given options. When the wage rate paid for the labor rises, then: (i) Supply of labor raises (ii) Opportunity cost of the leisure increases. (iii) Workers always supply additional labor. (iv) Level of the na