1. In the waning seconds of Superbowl XLVII, the Baltimore Ravens elected to take a safety rather than punt the ball. A sports statistician wishes to analyze the effect this decision had on the probability of winning the game.
(a) Which two of the following probabilities would most help the statistician perform his analysis? P(Win¦Safety); P(Safety¦Win); P(Punt¦Win); P(Win¦Punt); P(Win); P(Win∩Safety), P(Win∩Punt)?
(b) Define (in words) what the probabilities that you selected in part (a) mean and explain (in words) why they would be useful to the analysis.
2. Let A1;A2, and A3 be events in Ω. Show that P(A1 ∩ A2 ∩ A3) = P(A1¦A2 ∩ A3)P(A2¦A3)P(A3).
3. Let A and B be events such that P(A) > 0 and P(B) > 0. Show that P(AjB) = 1 - P(A¦B)
4. A business is keeping track of how many of two parts A and B are ordered, and whether those orders are completed on time or late. The data is in the table below.
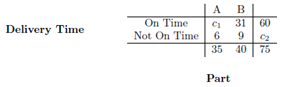
(a) Find c1 and c2.
(b) Do type of part ordered and delivery time appear to be independent?
(c) A customer calls and angrily complains that the part he ordered was late without giving any more details. Which type of part did the customer most likely order?
5. A medical company is developing a new test for breast cancer. Based on lab results, the test appears to have 90% specicity (the percentage of all women without the disease that the test correctly identies) and 95% sensitivity (the percentage of all women with the disease that the test correctly identies). Suppose that 12% of women who take this test have breast cancer.
(a) What is the false positive rate for this test?
(b) What is the false negative rate for this test?
(c) How will the false positive and false negative rates for this test be a ected if the percentage of women with breast cancer decreases?
6. An urn contains a red ball, a white ball, a green ball, and a plaid ball. A single ball is randomly drawn from the urn. Let A be the event that either the red ball or the plaid ball is drawn, let B be the event that either the white ball or the plaid ball is drawn, and let C be the event that the green ball or the plaid ball is drawn.
(a) What is P(A υ B υ C)?
(b) Are A, B, and C independent from each other?
(c) Are A, B, and C mutually independent?
7. You have two decks of cards in front of you. One deck is a standard 52 card deck with four aces. The other also has 52 cards, but eight aces instead of four. You randomly choose a deck and draw two cards without replacement.
(a) What is the probability of drawing at least one ace?
(b) Given that you drew at least one ace, what is the probability that you drew from the standard deck?