--%>

Under negative income tax the net income

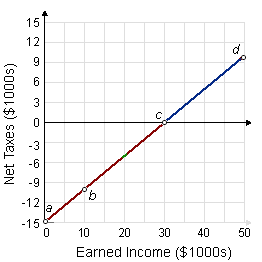
Under the negative income tax system demonstrated in this figure, where a family of four all along with earned income of $60,000 yearly would have a net [after-tax] income of: (1) $37,500 per year. (2) $42,500 per year. (3) $50,000 per year. (4) $55,000 per year. (5) $60,000 per year.

1122_Negative Income Tax Problem.png

How can I solve my Economics problem? Please suggest me the correct answer.

   Related Questions in Microeconomics

  • Q : Least commonly finance investment in

    Business firms least commonly finance investment within new economic capital by: (w) retained earnings. (x) the issuance of common or preferred stocks. (y) borrowing from banks or other financial institutions. (z) gra

  • Q : Price elasticities for market demand

    Of the given price elasticities [ed] for market demand curves, there the one which is absolutely implausible by the vantage of standard economic theory would be one for that, across all conceivable ranges of prices: (1) ed= 0 and the

  • Q : Economic Efficiency in Financial

    Financial institutions make possible economic efficiency primarily since: (w) laissez faire markets handle asymmetric information poorly. (x) corporate ownership must be stabilized. (y) they channel funds from agents along with surplu

  • Q : Kinked Demand by increasing price In

    In this kinked demand curve model as in demonstrated, when this firm operates at point a and increases its price from P2 to P3 and its rival firms respond by increasing their prices, in that case this firm will move from point a

  • Q : Problem on law of demand Let think

    Let think about the law of demand. The idea that a big price for a normal good will outcome in less of the good being bought never based logically on the: (i) Income effect. (ii) Demand for the good falling since of the higher price. (iii) Law of redu

  • Q : Monopolistic-Exploitation problem In

    In equilibrium for the price maker firm, the rate of monopolistic exploitation is the difference between: (i) P and MR. (ii) P and MC. (iii) Total revenue and net cost per unit of output. (iv) Output price and rate of monopsonistic exploitation. (v) VMP and MRP.

  • Q : Equilibrium moves market increase in

    When equilibrium moves from point a to point b, the simple market experiencing a raise in supply is demonstrated within: (w) Panel A. (x) Panel B. (y) Panel C. (z) Panel D.

    Q : Annual economic profit of production

    When point e corresponds to $18 per copy for St. Valentine’s Day software, so Prohibition Corporation can produce annual economic profit of at most just about: (i) $100 million. (ii) $140 million. (iii) $200 million. (iv) $300 million. (v) $400

  • Q : Income elasticity of positive and

    This given figure as in below demonstrates how consumption of goods A, B, C and D varies like a family’s income changes. Since income rises, the income elasticity of demand is positive and increasing for: (w) good A. (x) good B  (y) good C.

  • Q : Statistical perspective of Inferior

    On an average, American families with more income tend to contain fewer children than families with less income. This fact recommends that, at least from a purely statistical perspective, the American children are: (1) Inferior goods. (2) Substitute goods for the cats