Short run supply of an industry
The cranberry industry’s short-run supply is demonstrated as: (i) curve A. (ii) curve B. (iii) curve E. (iv) curve F. (v) curve G. How can I solve my Economics problem? Please suggest me the correct answer.
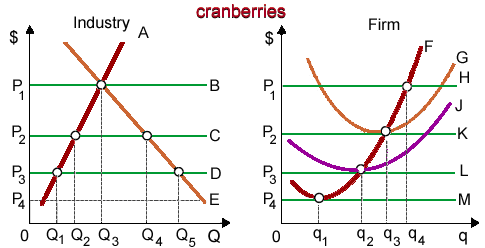
The cranberry industry’s short-run supply is demonstrated as: (i) curve A. (ii) curve B. (iii) curve E. (iv) curve F. (v) curve G.
How can I solve my Economics problem? Please suggest me the correct answer.
Name the Canada’s top three trading partners?
Each and every market is characterized by: (i) Widespread advertising, marketing, and sales promotions. (ii) Demands from each and every individual for all products. (iii) Potential buyers ready to pay and potential sellers ready to supply. (iv) Government licenses pr
With a specific market demand for the product and a specific market labor supply curve, the employment will be smallest if a firm is: (1) Monopolist in product market and a pure competitor in the labor market. (2) Pure competitor in labor and product markets. (3) Pure
When the price elasticity of demand for fried cheesy grits at Pixie’s Breakfast Grill is two, in that case a price cut of $2.80 to $2.00 per serving of grits would be most probably to: (1) reduce Pixie’s revenues from grits by roughly fort
The three reasons for downward slope of a demand curve are: (1) Diminishing marginal utility, income effect and the substitution effect. (2) Scarcity, tastes & preferences, and purchasing power. (3) Opportunity costs, rational decision making and
When a collective bargaining contract comprises a ‘check-off provision’ then: (1) Union workers can be fired if they don’t meet production quotas. (2) Firms collect the union dues by deducting them from pay-checks. (3) Workers are needed to do just t
Extensive national advertising can be a form of: (1) natural barrier. (2) strategic barrier. (3) regulatory barrier. (4) price discrimination. (5) moral hazard. Can anybody suggest me the proper explanation for given problem regard
The maximum valuable human capital on the given list would be possessed by the person who: (1) Inherited a big deal of money. (2) Invested big sums on stock market. (3) Had an advanced degree in the music education. (4) Specialized as the medical doctor.
A firm generating where MC = SRAC = LRAC operates at the minimum point of its: (w) short-run and long-run average total cost curves. (x) long-run total cost curve. (y) total physical product of labor curve. (z) maximum profit curve. Q : Relatively price inelastic demand For For Cournot’s Spring Water the demand is relatively price inelastic at: (i) point a. (ii) point b. (iii) point c (iv) point d. (v) point e. Discover Q & A Leading Solution Library Avail More Than 1453671 Solved problems, classrooms assignments, textbook's solutions, for quick Downloads No hassle, Instant Access Start Discovering 18,76,764 1944893 Asked 3,689 Active Tutors 1453671 Questions Answered Start Excelling in your courses, Ask an Expert and get answers for your homework and assignments!! Submit Assignment
For Cournot’s Spring Water the demand is relatively price inelastic at: (i) point a. (ii) point b. (iii) point c (iv) point d. (v) point e. Discover Q & A Leading Solution Library Avail More Than 1453671 Solved problems, classrooms assignments, textbook's solutions, for quick Downloads No hassle, Instant Access Start Discovering 18,76,764 1944893 Asked 3,689 Active Tutors 1453671 Questions Answered Start Excelling in your courses, Ask an Expert and get answers for your homework and assignments!! Submit Assignment
18,76,764
1944893 Asked
3,689
Active Tutors
1453671
Questions Answered
Start Excelling in your courses, Ask an Expert and get answers for your homework and assignments!!