--%>

Reading Production Possibilities Frontiers graph

I have a problem in economics on reading the Production Possibilities Frontiers graph. Please help me in determining the right answer from the following question. The graph below depicts the mythical country of the Sandwichia’s:

837_Production possibilities frontier.png

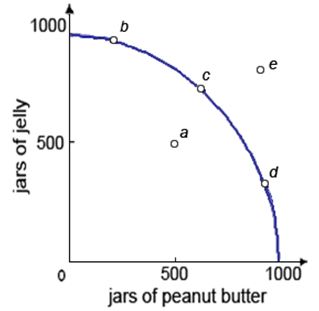
(1) Production possibilities frontier. (2) Trade-off among reward and risk. (3) Circular flow of the income. (4) Total demand curve. (5) Total cost curve.

Please choose the right answer from above...I want your suggestion for the same.

   Related Questions in Microeconomics

  • Q : Bilateral Monopoly model problem Can

    Can someone please help me in finding out the accurate answer from the following question. The bilateral monopoly model is: (i) Among the most modern models of the union bargaining. (ii) Very helpful in describing specific labor agreements. (iii) The theory of dynamic

  • Q : LEAST capable inventories of

    A competitive firm is LEAST capable to adjust its inventories throughout the: (w) market period. (x) short-run. (y) intermediate period. (z) long-run. Hello guys I want your advice. Please recommend some views for above Eco

  • Q : Time Estimates for Individual

    Time Estimates for Individual Activities: A) Weighted Average Activity Time, t =  (a + 4m + b)/6B) Standard deviation of activity times, σt = (b-a)/6C) Standard d

  • Q : Profit-maximizing output to maximizes

    HoloIMAGine has patented a holographic technology which creates 3-D photography obtainable to consumers. So HoloIMAGine’s: (w) lowest possible average total cost arises at precisely the output where profit is maximized. (x) market supply curve is the same to its

  • Q : Breaking natural monopoly Breaking a

    Breaking a natural monopoly within a number of competing firms would probably: (w) increase output and lower price to consumers. (x) reduce output and raise price to consumers. (y) reduce efficiency but lower price. (z) have no effect on output or pri

  • Q : Price elasticity and market power The

    The price elasticity of demand equals one when this firm produces where total revenue is: (i) $72,000 per period. (ii) $80,000 per period. (iii) $96,000 per period. (iv) $100,000 per period. (v) $144,000 per period.

    Q : Lorenz curve as graphical device A

    A Lorenz curve is graphical device which can be utilized to portray the: (w) number of people below the poverty level. (x) conflict between high tax rates and high tax revenues. (y) relative inequalities in the distribution of a variable across a popu

  • Q : Effects of price in Complementary Goods

    The demands for vast new sport utility vehicles [or SUVs] like Hummers and Ford Explorers would most likely reduce most sharply in response to a 50%: (i) Rise in the annual cost of driver’s license. (ii) Decreasing in rent on luxury apartments on the center of b

  • Q : High poverty rate among not employed

    The high poverty rate in between those who do not work: (w) reflects voluntary choices for leisure over income and work. (x) is no cause for concern if it involves voluntary choice. (y) occurs since family responsibilities prevent many people from wor

  • Q : Problem on financial Intermediation The

    The main reason for the existence of financial intermediaries is as: (1) Direct flows of savings from the individuals to firms would necessitate higher transaction costs. (2) That just wealthy individuals can afford to invest in the stocks and bonds. (3) The habits of