--%>

Ratio of perfect equality and Lorenz curve

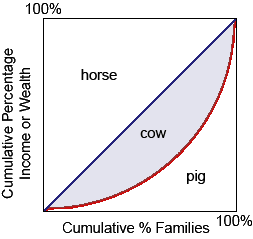
The ratio of the area between the perfect equality reference line and the Lorenz curve is the: (w) Gini index. (x) relative income (y) poverty line (z) marginal productivity standard.

1082_Lorenz Curve Problem.png

Please choose the right answer from above...I want your suggestion for the same.

   Related Questions in Microeconomics

  • Q : Average variable cost at price of

    A monopoly facing a demand curve which has segments higher than its average variable cost curve that sets price: (w) equal to MR. (x) equal to marginal costs [MC]. (y) from the market demand curve after finding the quantity where is m

  • Q : Firms in industry change When the firms

    When the firms are earning abnormal gains, how will the number of firms in industry change? Answer: The number of firms in industry will tend to rise.

  • Q : Predatory behaviour in increase price

    Predatory behavior would not comprise: (w) lowering prices. (x) expanding output. (y) rapid technological innovation. (z) raising prices. Can anybody suggest me the proper explanation for given problem regarding

  • Q : Linear supply curves-elasticity for

    A straight-line that positively sloped supply curve which starts from the basis is: (w) elastic for all prices and quantities. (x) inelastic for all prices and quantities. (y) unitarily elastic for all quantities and prices. (z) negatively associated

  • Q : Choosing a statistical Model Choosing a

    Choosing a statistical Model: A number of problems arise in determining whether the work is truly rigorous or not. It is important to determine whether the model chosen makes theoretical and intuitive sense. <

  • Q : Problem on hyperinflation In the year

    In the year 2015, people begin utilizing dollar bills to wipe up messes as hyperinflation has driven the price of ‘real’ paper towels to $7,000 a roll. This is an illustration of: (1) The income result. (2) Diminishing the marginal utility

  • Q : Percentage change in quantity demanded

    The percentage change within quantity demanded along this demonstrated linear demand curve is: (w) greater than the percentage change within price in range b. (x) smaller than the percentage change within price in range a. (y) precise

  • Q : Weekly economic profit of profit

    The profit maximizing firm currently here in illustrated graph can generate a weekly economic profit of approximately: (1) $29,000. (2) $31,500. (3) $34,000. (4) $36,500. (5) $39,000.

    Q : Rent controls fix rent in equilibrium

    Rent controls which fix rents below equilibrium will NOT: (w) maintain monetary rents down. (x) create shortages of rental housing. (y) stimulate non-market allocations of rental housing. (z) maintain the opportunity costs of housing down.

  • Q : Illustration of a natural monopoly Of

    Of the given firms, the best illustration of a natural monopoly is: (i) Dell, the largest seller of personal computers. (ii) Toyota, i.e., the huge car company in the world. (iii) OPEC, i.e., the international oil cartel. (iv) Google that dominates th