--%>

Problem on siyazama production possibilities frontier

The table below  contains information about  the production possibilities frontier ( PPF or PPC)  of siyazama agricultural cooperative.

354_ques2.jpg


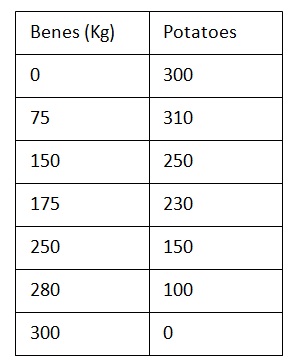
A) Plot a fully  labelled diagram to illustrates siyazama  production possibilities  frontier.
(Plot  the production of potatoes on the  x axis)

B) what  is the opportunity cost of increasing the production  of beans form 150Kg to 175Kg ?

C) What  is the significance of the points of the PPF?

D) Is  it possible for  siyazama agricultural cooperative to increase the production of beans and potatoes to 320 and 360Kg respectively? Support  you answer.

E) What  do the points ( Level  of production) inside the PPF  indicate?

F) How  can the PPC model  be used as a management tool in your  organization?

E

Expert

Verified

Siyazama’s production possibilities frontier with production of potatoes on the x-axis is below. The shape of the frontier indicates the principle of increasing cost, since production of more of one product will result in the sacrifice of larger amounts of the other product.

1206_frontier.jpg

In moving the production of beans from 150kg to 175kg, 25kg of beans are gained at the expense of 20kg of potatoes. Thus the opportunity cost of 25kg of beans is 20 kg of potatoes.

The points A to G on the PPF indicates the most efficient use of resources by the company. In order for the firm to produce more beans, it must give up some of the resources it employs to produce potatoes (point A). If the firm produces more potatoes (represented by points B to F), the firm must divert resources from making beans and simultaneously it will make less beans than it is producing at point A. In order for the firm to produce more potatoes, it must give up some of the resources it employs to produce beans (point G). However, these points A to G indicate the most efficient allocation of resources for the firm. The company must determine how to achieve the PPF and which combination of production will benefit the firm more to use. Based on demand and supply of beans and potatoes in the market, the firm must alter its combinations on the PPF.

Yes, it is possible for Siyazama Agricultural Cooperative to increase the production of beans and potatoes to 320kg and 360kg respectively. This output level, in general, is currently unreachable by the Cooperative, but if there is a change in technology, while the resource levels such as levels of labor, land and capital remains constant, the output level can increase and the PPF will be pushed upward or outward and a new PPF will later represent the efficient allocation of resources.

The points inside the PPF indicate that the cooperative is operating at less than capacity. In short, it will be a combination of goods where the cooperative produces less than its normal capacity. Hence it will represent inefficient use of resources or under-utilization of resources. If the cooperative wants to save some of its resources for the future for any purpose, such points inside the PPF can be useful.

The PPF model is very useful for the management to achieve a comparative advantage. When a firm focuses on manufacturing a combination of goods, it must come up with a plan to allocate its resources efficiently. There are higher chances for the firm to end up in inefficient allocation of resources which may hinder its future growth. When a PPF is employed, it points out the efficient allocation points, wherein the firm can prosper and enhance its resources. By determining the PPF, points inside and outside can also be determined. Production possibility frontier can be applied to numerous management issues. Diversification of production activities and resources provide considerable benefits for cutting down costs and passing on the lower prices to the consumers. This need not apply to manufacturing alone but this can also be applied to services as well. Any firm will need to allocate its resources between its products and services efficiently for maximum results.

   Related Questions in Microeconomics

  • Q : Purchasing power of a consumers income

    The modification in purchases which results since changes in relative prices modify the purchasing power of a consumer's income is termed as: (i) Adjustment margin. (ii) Income effect. (iii) Demonstration effect. (iv) Transfer pattern. (v) Replacement

  • Q : What is change in quantity demanded

    Change in quantity demanded: When change in demand takes place due to price alone, it is termed as change in quantity demanded.

  • Q : Total fixed cost Total fixed cost: 1.

    Total fixed cost: 1. Fixed cost remains constant at each level of output ie it do not change with change in quantity.2. It can not be zero when output is zero.3. Its curve is parallel to X-aixs4.

  • Q : Price of related goods-consequence on

    Price of related goods: a) Substitute goods – Whenever the price of substitute goods raises they become dearer whenever the price replaces goods falls they bec

  • Q : Decrement in opportunity costs and

    Opportunity costs and prices tend to be decreased by: (w) competition among speculators and other intermediaries. (x) price floors. (y) the exercise of monopoly power. (z) price ceilings. How can I

  • Q : Earn zero economic profit by

    When a monopolistic competitor is earning zero economic profit, in that case this: (1) sells at a price equal to average total cost. (2) sells at a price equal to marginal cost. (3) is at the minimum point on its average total cost cu

  • Q : Consumer Equilibrium-Utility

    Assume that you are an avid golfer and profit $36 worth of pleasure from the first golf hole played on any specific day, however the additional pleasure you profit from playing succeeding holes falls by $2 per extra hole. The $40 greens fee is needed to begin golfing

  • Q : Diminishing Marginal Utility of a good

    Whenever eating a whole pizza and realizing that the last piece didn’t taste almost as good as the first, you are experiencing is: (1) Diminishing the marginal utility. (2) Law of comparative advantage. (3) Law of income effect. (4) Law of supply.

  • Q : Unexpected growth of inventories Can

    Can someone help me in finding out the right answer from the given options. Whenever the quantity of a good supplied surpasses the quantity demanded: (i) Unexpected growth of inventories will cause prices to drop. (ii) The present market price is beneath equilibrium.

  • Q : Determine total costs by

    Hey guys I need your idea for this query regarding the total costs as illustrated graph that this profit-maximizing pure competitor’s total cost (TC) equals area as: (w) 0Phq2. (x) 0bgq2. (y) 0aeq1. (z) daef.

    Discover Q & A

    Leading Solution Library
    Avail More Than 1417982 Solved problems, classrooms assignments, textbook's solutions, for quick Downloads
    No hassle, Instant Access
    Start Discovering

    18,76,764

    1947852
    Asked

    3,689

    Active Tutors

    1417982

    Questions
    Answered

    Start Excelling in your courses, Ask an Expert and get answers for your homework and assignments!!

    Submit Assignment

    ©TutorsGlobe All rights reserved 2022-2023.