Problem on equilibrium price
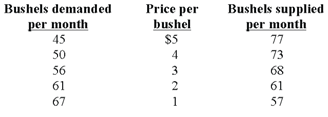
Refer to the following data. Equilibrium price will be: A) $4. B) $3. C) $2. D) $1. Give the answer of above questaion
Refer to the following data. Equilibrium price will be: A) $4. B) $3. C) $2. D) $1.
Give the answer of above questaion
The change in profit by producing an extra unit of good equivalents: (w) marginal revenue [MR]. (x) marginal revenue minus marginal cost [MR – MC]. (y) MR = MC. (z) ATC - AVC. Hello guys I want your advice. P
A) Using appropriate tables and diagrams explain how price and quantity is determined in a free market economy. B) Briefly explain using the diagrams in 4.1 the followings two scenarios C) When
Can someone help me in finding out the right answer from the given options. Raised ‘love boat’ ticket sales in response to a sequence of stunning travel commercials point out a raise in the: (i) Quantity of romantic vacations demanded. (ii) Demand for the
A Lorenz curve can be utilized to demonstrate the: (w) functional distribution of income. (x) income necessary to maintain specified living standards. (y) demand for low wage labor. (z) cumulative percentage of income received by cumulative percentage
John Kenneth Galbraith refuses theories which suppose profit maximization in competitive markets. According to him, the big corporations dominate the economic activity as: (1) Corporate managers look for maximum gains for stockholders. (2) Government policies are mani
Normal 0 false false
The time and other opportunity costs incurred in obtaining information regarding products and prices and in that case driving to and from markets are illustrations of: (1) mobilization costs. (2) contracting costs. (3) transactions co
No profit-maximizing unregulated monopoly will function in the inelastic portion of the demand curve this faces since: (w) marginal revenue is negative. (x) total revenues are negative. (y) total revenue falls as less is produced. (z) marginal revenue
Minor inefficiencies generated since monopolistic competitors differentiate their products may be more than offset through the: (w) increase in economic equity. (x) expansion of the psychologically-meaningful choices obtainable to consumers. (y) reduc
Short-run shut-down point of the cranberry farm occurs at a price of: (i) P1. (ii) P2. (iii) P3. (iv) P4. (v) Not computable from these figures. Discover Q & A Leading Solution Library Avail More Than 1414881 Solved problems, classrooms assignments, textbook's solutions, for quick Downloads No hassle, Instant Access Start Discovering 18,76,764 1947684 Asked 3,689 Active Tutors 1414881 Questions Answered Start Excelling in your courses, Ask an Expert and get answers for your homework and assignments!! Submit Assignment
18,76,764
1947684 Asked
3,689
Active Tutors
1414881
Questions Answered
Start Excelling in your courses, Ask an Expert and get answers for your homework and assignments!!