--%>

Market adjustment for new equilibrium at prices and quantity

This market for peanuts will adjust to a new equilibrium at price: (1) P0 and quantity Q0. (2) P1 and quantity Q0. (3) P2 and quantity Q2. (4) P3 and quantity Q1. (5) P1 and quantity Q1.

571_example of Equilibrium1.png

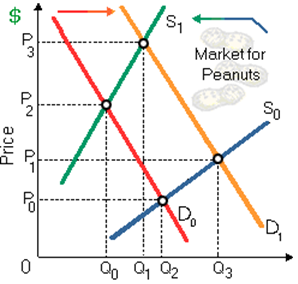
How can I solve my economics problem? Please suggest me the correct answer.

   Related Questions in Microeconomics

  • Q : Determine market demand in curve The

    The market demand curve as in demonstrated figure for Christmas trees is: (i) curve A. (ii) curve E. (iii) curve F. (iv) curve G. (v) curve J.

    Q : Negatively sloped market power The

    The demand curve which confronts a: (i) competitive industry is perfectly elastic. (ii) purely competitive firm is downward sloping. (iii) monopolistic firm is horizontal. (iv) monopolistic industry is upward-sloping. (v) firm along with market power

  • Q : Wage Discrimination-Monopsonistic

    Whenever an organization’s wage structure reflects the keenness of individual staff to work, terms which are most applicable comprise: (i) Monopsonistic exploitation & wage discrimination. (ii) Monopolistic exploitation and the separation of possession and c

  • Q : Process of Capitalization

    Capitalization is a process which converts: (1) natural resources into economic capital. (2) predictable income flows within wealth. (3) the opportunity cost of capital into the market interest rate. (4) financial capital into economic investment. (5)

  • Q : Problem on siyazama production

    The table below  contains information about  the production possibilities frontier ( PPF or PPC)  of siyazama agricultural cooperative.

  • Q : Reflecting normal substitution by

    When consumer demand for this industry’s product is relatively inelastic, in that case the curve reflecting normal substitution although the least price elasticity of market demand would be of: (i) curve A. (ii) curve B. (iii) curve C. (iv) curv

  • Q : Average standard of living in Africa

    Elucidate briefly the average standard of living in Africa?

  • Q : Cross-elasticity of demand Interpret

    Interpret the following Cross-Price Elasticities of Demand (XED) and explain the relationship between these goods. (3 marks total, 1.5 marks per part) XED= + 0.64 and XED= -2.6

  • Q : Problem on price elasticity and total

    A) Use the table below to draw graphs that show the relationship between price elasticity of demand and total revenue. <

  • Q : Determining national income Suppose an

    Suppose an economy is in equilibrium condition. Its consumption function is C = 300 +0.8Y and investment is 700 find out its national income.