--%>

Marginal revenue curve with marginal power

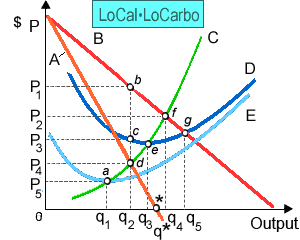
LoCalLoCarbo has turn into the favorite of fad dieters. There in demonstrated figure curve A shows: (i) LoCalLoCarbo’s marginal cost curve. (ii) LoCalLoCarbo’s average variable cost curve. (iii) LoCalLoCarbo’s average total cost curve. (iv) the market demand curve facing LoCalLoCarbo. (v) LoCalLoCarbo’s marginal revenue curve.

110_Market Power and Marginal Revenue.png

How can I solve my Economics problem? Please suggest me the correct answer.

   Related Questions in Microeconomics

  • Q : Inefficient economic monopolists

    Monopolists are frequently considered inefficient since they set: (w) MR = MC to maximize profits. (x) P > MSC. (y) MSR < MSC. (z) output where average revenue equals price [AR = P] as well as marginal revenue equals marginal cost [MR = MC].

  • Q : Minimum average costs Prohibition

    Prohibition Corporation could attain minimum average costs for its St. Valentine’s Day software when this produced: (1) 4 million copies. (2) 6 million copies. (3) 8 million copies. (4) 10 million copies. (5) 12 million copies.

    Q : Isoquants and isocost lines By using

    By using isoquants and isocost lines, illustrates graphically that rise in y will result in a decline in the quantity demanded of x1 and also illustrates that rise in the price of x1 will result in a reduction in the quantity demanded of x1<

  • Q : Supply curve Select the right answer of

    Select the right answer of the question. A supply curve that is a vertical straight line indicates that: A) production costs for this product cannot be calculated. B) the relationship between price and quantity supplied is inverse. C) a change in price will have no ef

  • Q : Labor Unions Strikes-Limiting the

    Can someone please help me in finding out the accurate answer from the following question. The word regular unionized employees apply to non-union workers who get jobs with firms whenever the unionized employees strike for maximum wages and enhanced working conditions

  • Q : Determine the yearly total revenues

    When the U.S. wheat market as in below demonstrated graph is primarily within equilibrium on S0D0, in that case the yearly total revenues (price × quantity) of wheat farmers will equivalent: (1) 0P4gQ4

  • Q : Negative Rate of Return by Financial

    The financial investment probably to generate a negative rate of return is the: (w) cost of your college education. (x) purchase of a lottery ticket. (y) $25,000 each a group of business people paid to buy franchises within the American Football League into 1960 year.

  • Q : When are price variation tendencies

    Price variation tendencies are indeterminate while we know simply that: (1) super star salaries make this hard for team owners to meet rising demands for sporting events. (2) more people main in music although demands for musicians are falling. (3) oi

  • Q : Competitive pressures produce by

    Economic losses produce competitive pressures which decrease the industries: (w) output and number of firms. (x) prices and profits. (y) percentage mark-ups over costs. (z) long term labor turnover. I need a good a

  • Q : Long-run supply curve in constant cost

    When cranberries are a constant cost industry and that firm is typical, in that case the industry’s long-run supply curve is curve as: (i) curve A. (ii) curve B. (iii) curve C. (iv) curve D. (v) curve E.

    Discover Q & A

    Leading Solution Library
    Avail More Than 1449324 Solved problems, classrooms assignments, textbook's solutions, for quick Downloads
    No hassle, Instant Access
    Start Discovering

    18,76,764

    1939345
    Asked

    3,689

    Active Tutors

    1449324

    Questions
    Answered

    Start Excelling in your courses, Ask an Expert and get answers for your homework and assignments!!

    Submit Assignment

    ©TutorsGlobe All rights reserved 2022-2023.