Goods and services
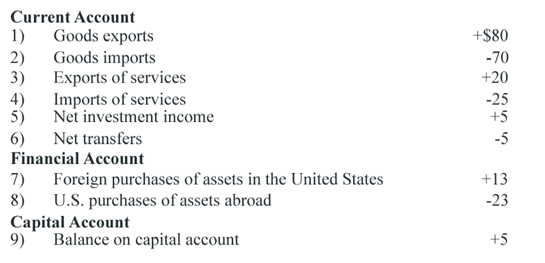
Refer to the above data. Choose the right answer from following. Zabella's balance on goods and services illustrates a: A) $5 billion deficit. B) $5 billion surplus. C) $10 billion surplus. D) $15 billion deficit.
Poverty is most unambiguously: (w) an absolute concept that is easily and precisely defined. (x) more prevalent in North America than elsewhere. (y) the absence of income sufficient to survive in reasonable comfort. (z) a relative concept when poverty
When a purely competitive industry is within long-run equilibrium and consumer demand then raises, the short-run industry quantity supplied and equilibrium price would tend to: (w) fall. (x) rise. (y) remain similar. (z) swing up and
The purely competitive firm in the output market which hires from a purely competitive labor market will employ the labor at the point where VMP = W as the firm: (i) Operates in society's best interest. (ii) Wants to be quite fair to workers. (iii) Is egalitarian inst
Marginal revenue: This refers to the addition prepared to the total revenue.
Transaction costs tend to be decreased, consumer prices tend to be lower and additionally stable and economy-wide efficiency is enhanced if: (1) rigid wage and price controls are imposed. (2) central planning fosters
An increase in the income of Consumer X leads to fall in demand for that good by that consumer. Name the good X termed? Answer: Inferior good
On Indian industry what are the effects of globalization?
When the rate of return on investment equals the interest rate, in that case investment will: (w) rise. (x) fall. (y) not change. (z) Any of the above is possible. Hey friends please give your opin
Whenever kids abandon a short-lived fad for Dinosaur action figures, this would be exhibited by the: (1) Left-ward shift of demand curve. (2) Right-ward shift of supply curve. (3) Right-ward shift of demand curve. (4) Left-ward shift of supply curve. (5) Movement down
A nondiscriminating monopolist cannot maximize profits through producing where demand: (w) price elastic. (x) price inelastic. (y) above marginal cost. (z) above marginal revenue. Can someone explain/help me with b
18,76,764
1926808 Asked
3,689
Active Tutors
1432314
Questions Answered
Start Excelling in your courses, Ask an Expert and get answers for your homework and assignments!!