--%>

Find linear demand curve by quantity and price graph

Along this illustrated linear demand curve, there is: (1) inelastic portion is range a. (2) elastic portion is range b. (3) midpoint is unitarily price elastic. (4) elasticity is constant in each and every ranges. (5) midpoint elasticity becomes infinite.
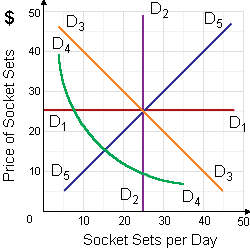
1993_Price Elasticity of Demand.png

Please choose the right answer from above...I want your suggestion for the same.

   Related Questions in Microeconomics

  • Q : Nominal wages If the nominal wages of

    If the nominal wages of carpenters rose by 5 percent in the year of 2000 and the price level increased by 3 percent, then the real wages of carpenters: A) decreased by 2 percent. B) increased by 2 percent. C) increased by 3 percent. D) increased by 8 percent.

  • Q : Determine equilibrium price and quantity

    Suppose a growth hormone is introduced that allows dairy farmers to offer 125 million more litres of milk per year at each price. a. Construct new demand and supply curves reflecting this change. Describe with words what happe

  • Q : Surviving firms in declining

    When firms exit a declining competitive industry, in that case surviving firms will: (i) reduce their outputs and prices. (ii) experience higher prices and profits. (iii) automate to adjust to lower wages. (iv) sell more output at lower prices. <

  • Q : Question on tax payer New agricultural

    New agricultural program named as the Payment-in-Kind Program is introduced by the Reagan Administration, in the year of 1983. In order to distinguish how the program performed, consider the wheat market. Had the government not given the whea

  • Q : Victimization of Adverse Selection When

    When an heiress’s fiance plans to murder her soon subsequent to the wedding in order to inherit her estate, she has actually been victimized by: (1) Moral hazard. (2) Adverse selection. (3) Cognitive dissonance. (4) Irrational ignorance.

    Q : Demonstrates the Lorenz Curve This

    This given figure demonstrates as: (w) Lorenz curve. (x) familial income distribution graph. (y) Gini curve. (z) Blanc income standard curve. </span></p>
                                        </div>
                                        <!-- /comment-box -->
                                    </li>
   
   </td>
	</tr><tr>
		<td>
       
      <li>
                                        <div class=

    Q : Wealth distribution by income When line

    When line 0C0' shows the 2005 U.S. income distribution, in that case the line that would shows the 2005 wealth distribution would be probably line: (1) line 0A0'. (2) line 0B0'. (3) line 0C0'. (4) line 0D0'. (5) line 0E0'.

  • Q : Profit Maximization in Labor Markets

    Each and every profit maximizing organizations employ labor up to the point where: (1) VMP = w. (2) MRP = MFC. (3) VMP = MRP. (4) VMP = MFC. (5) MR MC is maximized. Can someone please help me in finding out the accurate answer from

  • Q : Problem regarding marginal factor cost

    In equilibrium for any of profit-maximizing firm, marginal revenue product of the labor: (i) Is equivalent to the change in net revenue related with selling an extra unit of output. (ii) Surpasses the wage rate by maximum possible. (iii) Equivalents marginal factor co

  • Q : Problem on Long-Run Adjustments Since

    Since longer time intervals are considered, the quantities demanded for most goods become __________ to any modification in price. (1) Directly related. (2) Less responsive. (3) Less enamored. (4) Indifferent. (5) More responsive.Find out the right answer from t