Consumption curve
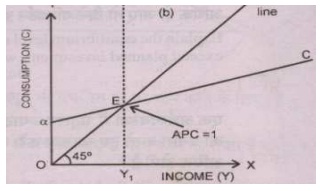
Illustrate a point on consumption curve at which APC = 1. Answer: APC = C/Y = 1 is possible when C = Y, that is, Consumption is equivalent to Income.
Illustrate a point on consumption curve at which APC = 1.
Answer:
APC = C/Y = 1 is possible when C = Y, that is, Consumption is equivalent to Income.
What are the strength and weakness of using per capital national income? give explained answer for query
‘The country is at present in recession and this has led to worse tax revenue and high expenses. The effect is a huge deficit. The government decides to increase taxes and lower government expenses. Is this an excellent idea?’
What relationship does the MPC bear to the size of the multiplier? The MPS? What will the multiplier be when the MPS is 0, .4, .6, and 1
The demand curve for DVD games is a straight line, therefore its slope: (1) Is constant, although price elasticity of demand drops/falls as output increases. (2) Price elasticity are both stable. (3) Is constant, although price elasticity of demand increases as the pr
Define fiscal policy? Answer: Fiscal policy is the revenue and expenditure policy of government with a view to combat the state of inflationary or deflationary gap
Collect cost, revenue data or other relevant data from the airbus industry and describe how you would modify the data to make it relevant to decisions a manager should make.
Family member to macroeconomics, the microeconomic analysis: (w) was emphasized through economists prior to the Great Depression. (x) is related with the effects of extensive government policies. (y) focuses upon economic development
what are the four supply factors of economic growth
What are the causes of the fiscal deficits experienced by many developed nations in the past three years and what are the main effects of the resulting government borrowing? For example – Greece/Ireland/Portugal/Spain situation and the large def
how many systems of note issue are there??
18,76,764
1951527 Asked
3,689
Active Tutors
1417859
Questions Answered
Start Excelling in your courses, Ask an Expert and get answers for your homework and assignments!!