--%>

Average rate of return in Human Capital

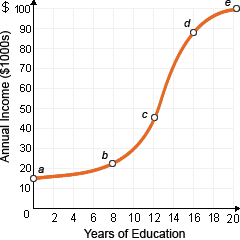
This illustrated graph indicates that, there on average, rate of return to education is greatest for finishing the previous year of: (1) kindergarten, at point a. (2) grade school, at point b. (3) high school, at point c. (4) undergraduate college, at point d. (5) a professional degree (for example, doctor or lawyer) at point e.
1106_Human Capital problem.png

Can anybody suggest me the proper explanation for given problem regarding Economics generally?

   Related Questions in Managerial Economics

  • Q : Formulate the Cross Elasticity of demand

    Formulate the Cross Elasticity of demand?

  • Q : Aggregate Supply of Labor Labor

    Labor supplies for the economy as an entire are LEAST determined through: (w) labor unions. (x) wage rates and structures of wages. (y) education and training of the work force. (z) labor force participation rates. Hey friends plea

  • Q : Explain the target pricing briefly

    Explain the target pricing briefly.

  • Q : Purely competitive labor market is

    When this purely competitive labor market is firstly in equilibrium at D0L, S0L, a move to equilibrium at D1L, S0L would be inconsistent along with increases in: (w) the price of output. (x) labor productivi

  • Q : Decline in equilibrium marginal revenue

    Declines within the equilibrium marginal revenue product of a firm’s workers are probably to follow the adjustments to: (1) increases in specific training. (2) decreases in the wage rate. (3) increases in the demand for output. (4) hikes in the

  • Q : Substantial general training in firm A

    A firm which provides its workers along with substantial general training tends to: (1) retain such individuals by paying them the relatively highest wage premiums. (2) require workers to sign legal contracts of peonage and indenture. (3) increase wor

  • Q : Advantages and Disadvantage of Naïve

    What are the advantages and disadvantage of naive method?

  • Q : Which progress illustration was Pilgrims

    Agricultural productivity within Massachusetts Bay Colony increased while Native Americans showed Pilgrims how crops grow faster and better when rotten fish are dropped in along with newly-planted seeds. This new knowledge for the Pilgrims was an illustration of: (1)

  • Q : Demad elacticty demand function is: QY

    demand function is: QY = -8,000 - 5,000PY + 192A + 120I + 2,000PX (6,000) (1,000) (120) (80) (800) R2 = 91% Here QY is quantity (measured in units) of Product Y demanded in the current period, A is hundreds of dollars of advertising ($00), I is thousands of dollars of disposable income per ca

  • Q : Equilibrium point on the resource

    An equilibrium point on the resource demand curve of a competitive firm operating within a competitive labor market would indicate equality among the resource price and: (w) demand elasticity. (x) quantity demanded. (y) VMP of the resource. (z) output