--%>

Area of Loren Curve

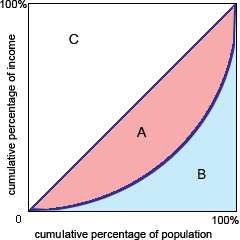
This function as in illustrated figure area between A and B is termed as a/an: (1) index of inequality. (2) Lorenz curve. (3) Pareto indicator. (4) Gini coefficient. (5) Marx-Engels curve.

1878_Lorenz Curves and Gini Coefficients.png

Can anybody suggest me the proper explanation for given problem regarding Economics generally?

   Related Questions in Microeconomics

  • Q : New cost-saving technologies adopting

    Firms are under greater pressure to rapidly adopt any new cost-saving technologies when an industry is: (i) closely regulated by government. (ii) controlled by professional managers instead of owners. (iii) dominated by a vast monopoly. (iv) highly co

  • Q : Illustrates the Loren curve by total

    When 40 percent of total personal income was received by 20 % of the highest income families, in that case the: (w) income distribution would be perfectly equal. (x) income pattern would be foreign to the U.S. (y) Lorenz curve would be the 45 degree r

  • Q : Law of demand is the price in the "law

    is the price in the "law of demand" a relative price or an absolute price

  • Q : Problem on cross-price elasticity Kathy

    Kathy purchases two goods, t-shirts and caps.  Her demand for t-shirts is: Qt = 44 – 3Pt - Pc + .04IThe price of caps is Pc = $2. And her income is I = $300.a. Graph a demand curve for Kathy’s t-shirts.

  • Q : Signaling definition Can someone please

    Can someone please help me in finding out the accurate answer from the following question. Job applicants employ polished resumes explaining education, skills and work experience, accompanied by the supportive letters of recommendation letters as tools in the procedur

  • Q : Ceiling price problem When the

    When the government obliged a ceiling price of P0 on papayas, the market scarcity would correspond to line: (1) ab. (2) cd. (3) ac. (4) bd. (5) ae. </span></p>
                                        </div>
                                        <!-- /comment-box -->
                                    </li>
   
   </td>
	</tr><tr>
		<td>
       
      <li>
                                        <div class=

    Q : Output level of profit maximizing of

    The profit maximizing competitive firm in illustrated graph will: (i) produce output level q5. (ii) minimize total costs by producing output level q3. (iii) experience fixed costs equal to 0P3fq4. (iv) produce output level q4. (v) inevitably experienc

  • Q : Differnt types of demand and supply i

    i want to understand different market competitions using graphs and solving some problems

  • Q : Aid for Dependent Children in Welfare

    The Aid for Dependent Children (AFDC), program has been condemned most for: (w) high crime rates among the poor. (x) the disintegration of low income family structures. (y) indifference to the plight of the less fortunate. (z) the bankruptcies of Clev

  • Q : Limit pricing model of strategic

    The assumption essential for the result of the limit pricing model of strategic behavior is: (a) entrant firms price at marginal cost. (b) entry and exit is relatively costless. (c) the incumbent firms will maintain old output levels after entry of a