Assignment:
1) A teacher asked each of her students how many novels they had read in the previous six months. The results are shown below.
0 1 5 4 2 1 3 2
2 7 2 5 0 1 0 1
1 2 6 0 2 3 1 2
7 1 4 2 3 1 7 0
0 2 1 1 0 6 1 7
Construct a frequency table for the number of novels read.
2) The frequency table shows the weights in ounces of 30 stones
Weight (oz) Number of Stones
1.2-1.6 5
1.7-2.1 2
2.2-2.6 5
2.7-3.1 5
3.2-3.6 13
Use the above information to construct a cumulative frequency table for the data.
3) Use the following data to construct a bar chart.
Job categories
Clerical Management Maintenance Professional Unemployed
5 4 6 2 1
Create a bar graph and place the above data in a bar graph.
4) The data below are the numbers of hours of homework done as reported by 24 high school juniors for the last week in September 2006.
6, 5, 6, 4, 6, 6, 9, 7, 6, 3, 8, 5, 5, 8, 6, 5, 8, 6, 5, 7, 5, 8, 7, 4
Create a histogram using the above data. Use bin width (size of the bar) of 2 hours.
5) Examine the stem and leaf plot below. Find the original data from the stem and leaf plot.
Stem Leaves
1 1,8 6
2 1,1,3,7
3 1,3,3,8,9
4 3,4
6) Create a stem and leaf plot with the following data.
10, 12, 33, 25, 22, 18, 19, 31, 28, 22, 13, 15, 15, 20, 21, 35, 32
1) The students of Hugh Logan's math class took the Scholastic Aptitude Test. Their math scores are shown below. Find the mean score.
552 593 358 352 537
349 357 596 470 482
2) The salaries of ten randomly selected physicians are shown below. Find the median salary.
$105,000 $149,000 $163,000 $214,000 $225,000
$116,000 $111,000 $791,000 $240,000 $178,000
3) Find the mode(s) for the given sample data.
20, 43, 46, 43, 49, 43, 49
4) The mathematics SAT scores of the seven students in a mathematics seminar are 533, 553, 578, 586, 619, 626, and 633. Suppose that the student with the score of 533 drops the seminar and is replaced by a student with a score of 765. What will happen to the mean and the median scores of the class? Explain.
5) Suppose there are 400 students in your school class. What class rank is the 20th percentile?
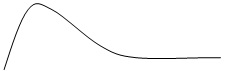
Look at the above distribution. What type is it and why?
6) What is the range and standard deviation for the following data:
2, 6, 15, 9, 11, 22, 1, 4, 8, 19
7) Use the following data to figure determine 1) the five number summary and 2) create a boxplot.
2.5, 3.3, 4.2, 5.9, 6.8, 7.2, 7.7, 8.5, 9.2, 9.9, 10.5