Project: Transmission Line Operation
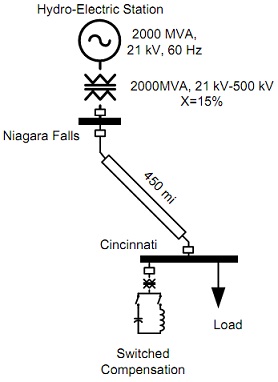
Consider the conductor arrangement of a power line under planning shown below. The line will connect the hydroelectric station at Niagara Falls, NY to Cincinnati, OH for a total transmission length of 450 mi away. The system is shown in the next figure. The line is designed to operate at 500 kV will be fully transposed to reduce the unbalance in the impedance. At the Cincinnati transmission station, a switched bank of reactive compensation will be employed to regulate the magnitude of the bus voltage at close to 1 pu.
The total load at Cincinnati varies daily from 200 to 2000 MVA at 0.85 lagging power factor. The bus voltage at Niagara and Cincinnati are regulated to 1 pu.
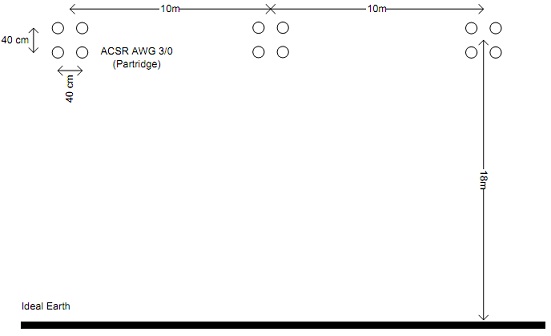
1) Confirm that the line configuration complies with the standard for the voltage level. Are any differences significant? How many insulator discs and how many shield wires are needed? Is the conductor size appropriate to carry the line current?
2) Compute the TL parameters. Include the effect of the earth as ideal. Do not incorporate the effect of the shield wires.
3) What are the line attenuation and phase propagation constants?
4) If we ignore losses, what is the wavelength of a propagating wave at 60 Hz? What is the line surge impedance? What is the line SIL?
5) Compute the reactive power that must be supplied by the switched reactive compensation bank at Cincinnati to achieve 1 pu voltage under (a) the maximum and (b) the minimum load.
6) Simulate the above system in Power World; use 1000 MVA as power base; include the line losses. Vary the load from minimum to maximum in 10 equal steps. In each case have PW compute the required reactive compensation from the switched bank to maintain the bus voltage at Cincinnati constant at 1 pu (within, say, a 1% error).
(a) Plot the compensator Q as functions of the load real power.
(b) Compute from PW and plot the reactive power of the generator at Niagara against the load real power.
7) Compute and plot the voltage profile in the line at (a) maximum and (b) minimum load.