This assignment needs a considerable amount of computer work and written comment. You might need to seek guidance from your tutor along the way. Do not leave things until too late. Each and every question carefully explains what you are required to do, so please follow the instructions carefully. Your answer to each and every question must begin with the number of the question.
In this assignment you will observe statistical data consisting of records of car accidents on Victorian roads and freeways in 2012. The Victorian department of transportation, Police and VIC Roads are interested in determining the major factors affecting car accidents in Victoria. They will utilize this information to develop strategies aimed at decreasing the number of fatalities on Victorian roads.
Alcohol is a main factor in road deaths in Victoria. Each year, about one quarter of drivers killed in road crashes had a blood alcohol concentration (BAC) of .05 or greater.
The Victorian road rules associating to the use of alcohol and drugs by drivers might be briefly summarized as follows:
Blood alcohol concentration:
Professional drivers such as truck, bus or taxi drivers should have a blood alcohol concentration (BAC) under 0.02; P-platers and learner drivers, as well as visitors from interstate or overseas, must have a zero blood alcohol concentration (BAC). All other drivers should stay under .05 BAC. You should be under .05 BAC while supervising a learner driver. This rule applies to public roads and as well private property.
Drug impairment:
This is illegal to drive while impaired by any drug whether that drug is legal or illegal. You should not be affected by illegal drugs while accompanying a learner driver. This rule applies to public roads and as well private property. (VIC Roads, 2012).
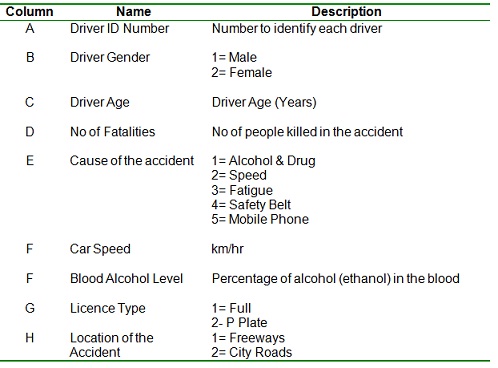
Data was collected and is contained in a file called and the columns of the file contain the given information:
Students must use their own random sample of 180recordsto answer the questions the random samples are in the file “find your name random samples for assignment.xlsx”.
Assignment Tasks:
For each task below, you should answer all the questions in sequential order and submit all of the required printouts, graphs, tables and summaries needed.
NB: Each graph and table must have a heading and each axis should have a label!!
Question: Introduction and Variable List: Give a short introduction to your report. Explain the nature of the data. Read questions below and briefly explain the specific data and relationships which will be examined here.
Question: Data: Provide a printout of the data in your sample, sorted in ascending order based on Driver ID number.
Question: Give a short comment about what you what would happen to the answers to your assignment if you had a different randomly selected sample of size 180.
Question: Produce a histogram exhibiting the age distribution of the drivers involved in car accidents. Give your comments on the graph shape, and the most appropriate measures of centre and spread for this data.
Question: Pivot Tables: There is a general feeling that male drivers commit more driving offences causing more accidents and more fatalities compared to female drivers. For each of the following prepare a contingency table (cross-classification table), by using the
Pivot Table option in Excel. Make sure to comment on similarities or differences and any conclusions you can draw in each case.
a) The average car speed in an accident for the cause of accident split on gender.
b) The average driver blood alcohol level in a road accident for each license type split on gender.
c) The number of road accident fatalities for each license type split on gender.
Question: T-Test and CI: The Victorian police believe that the average speed of vehicles included in accidents on Victorian highways is significantly higher than 100 km/hr.
a) Obtain suitable descriptive statistics and so compute a 95% confidence interval for the mean car speed in accidents on Victorian highways.
b) Conduct a statistical test to find out if the average car speed in accidents on Victorian highways is considerably higher than 100 km/hr. Mention any suppositions, comprise relevant hypotheses and report the outcomes and conclusion in the conventional way.
Question: Stratified scatter plot with trend lines: Obtain a stratified scatter-plot comparing the relationship between driver age and car speed (km/hr) in accidents for each gender. Think carefully regarding which variable must go on the vertical axis. Keep in mind; it is the independent variable which goes on the horizontal axis (that is, the x-axis). Comprise trend lines, their equations and R-squared values on the graph. Make sure you label axes appropriately and that your graph has a suitable title.
Briefly compare the nature of the relationship between these two variables, the driver Age (years) and Speed (km/hr), for males and females.
Question: Make a table of correlation coefficients for the following variables: Age, Number of Fatalities, Car Speed and Blood Alcohol Level. Discuss your results and state which pairs of variables have the maximum and the lowest correlation coefficients.
Question: Use Excel to carry out a regression analysis on the two variables: driver age (years) (independent variable) and car speed (km/hr) (dependent variable).
a) Copy the output into your assignment and use it to find out the answers to the given questions.
b) Write down the regression equation.
c) State the R-squared value and the standard error and elucidate what they mean with respect to the data.
d) Write down the value of the gradient of the regression line and describe what it means for this data.
e) Are the values for the constant and the gradient (slope) significant (that is, significantly different from zero) in this case? Validate your answer.
f) Do you think this regression model is a good model? Justify your answer by using the regression output.
Question: By using the information obtained for your analyses write a brief conclusion regarding what you found from the study above.