1. Repeatedly (104 times) simulate the standardised sum of independent and identically distributed variates X1, . . . ,Xn
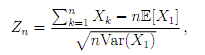
and provide histogram plots, with the (suitably renormalised) standard normal density curve superimposed, for
(a) X1 ~ Exp(1) and n = 2, 6, 1000.
(b) X1 ~ Ber(3=4) and n = 5, 20, 100.
Supply your code.