Assignment:
A tire company has carried out tests in which rolling resistance (pounds) and inflation pressure (pounds per square inch, or psi) have been measured for psi values ranging from 20 to 45. The regression analysis is summarized in the following Minitab printout:
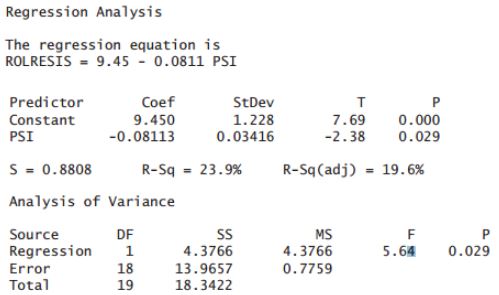
a. To the greatest number of decimal places in the printout, what is the least-squares regression line?
b. What proportion of the variation in rolling resistance is explained by the regression line?
c. At what level of significance does the slope of the line differ from zero? What type of test did Minitab use in reaching this conclusion?
d. At what level of significance does the coefficient of correlation differ from zero? Compare this with the level found in part (c) and explain either why they are different or why they are the same.
e. Construct the 95% confidence interval for the slope of the population regression line.
Provide complete and step by step solution for the question and show calculations and use formulas.