1. To study what fraction of houses for sale in Victoria has a finished basement, a researcher selected a random sample of 20 houses that were on the market. It was found that 11 of the houses surveyed did in fact have a finished basement.
(a) Using the random sample gathered by the researcher, compute a 95% confidence interval for proportion of houses for sale in Victoria that have a finished basement.
(b) After computing a confidence interval for proportion of houses for sale in
Victoria which have a finished basement the researcher felt that the received confidence interval was probably too wide to be of any practical use to realtors or potential buyers. So the researcher would like to collect a larger sample of houses for sale in order to acquire a better estimate. The wanted confidence interval is still a 95% confidence interval, and the researcher can make use of the estimate for p from the initial sample in order to decide on what sample size to use. What sample size must now be gathered in order to estimate the true proportion of houses for sale in Victoria that have a finished basement to within 0.05?
2. As part of a study of corporate employees, the Director of Human Resources for PNC wants to evaluate the distance travelled to work by employees at their once in down-town Edmonton with those in downtown Montreal. A random sample of 35 Edmonton employees showed they travelled a mean of 590 km per month, with a sample standard deviation of 50 km per month. A sample of 28 Montreal employees showed they travelled a mean of 610 km per month, with a sample standard deviation of 34 km per month. Assume that the populations are approximately normal. At the 0.05 significance level, would you conclude that there is a differentiation between the mean numbers of kilometres travelled per month by Edmonton and Montreal employees?
Clearly state your hypotheses, the observed value of the appropriate test statistic, the number of degrees of freedom of the test statistic you are using, and the p-value (or bounds on the p-value) that you will base your decision on, and state your actual conclusion.
3. An experimental surgical process is being studied as an alternative to the old technique. Both techniques are considered safe; however the new technique has the potential to reduce operating time. Five surgeons each operate on two patients that have been matched by age, sex, and other relevant factors, performing the old procedure on one patient and the new procedure on other. The time to complete each surgery (in minutes) is recorded in the following table.
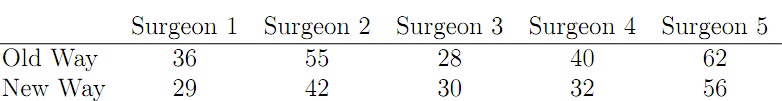
(a) Conduct a hypothesis test at significance level α = 0:05 to decide if there is adequate evidence to conclude that the new procedure is faster than the old one. You can suppose that the differentiations between the old and new times are normally distributed. As always, clearly state your hypotheses, the observed value of the appropriate test statistic, the number of degrees of freedom of the test statistic you are using, the p-value (or bounds on the p-value) that you will base your conclusion on, and state your actual conclusion.
(b) Use Excel to conduct the same hypothesis test as you conducted in part (a): To do this you will need to first enter the times for each method into two columns of a spreadsheet. Then, under the Data menu, and under the Data Analysis Tools menu, select the paired t-test. You will need to enter the Variable 1 Range and the Variable 2 Range. I used (A1:A5) and (B1:B5). Then enter the value of the Hypothesized Mean Difference as 0 and specify the value for α at which the test is being conducted. Cut and paste the output of the test into a word-processing document and include it with your assignment. You may need to stretch the columns of the output so that you can read all of the entries in the cells. Under your table, clearly state the observed value of the test statistic and the p-value given by Excel. Note that Excel will provide two p-values, depending on whether the test is a two-tailed test or a one-tailed test. Select the appropriate one. Would you make the same conclusion that you made in part (a)?