General Instructions:
• Make sure results are clearly laid out and easy to understand
• Clearly label all output values, and indicate answers to questions
• Graphs should have titles and appropriate labels for their respective axes
• Units for all values should be indicated
Question:
Suppose that x and y are independent and normally distributed random variables. The mean and variance of x are µx = 9 and σ2
x= 3. The mean and variance of y are µy = 8 and σ2y = 4.
a) The mean of the sum (or difference) of two independent random variables equals the sum (or difference) of their means, but the variance is always the sum of the two variances.
Use random number generation to verify this for the case z = x + y. Find the mean and variance of z by simulation, and compare the results with the theoretical prediction. Do this with simulations of 100, 1000 and 10000 samples.
b) If z = xy, find the mean and variance of z by simulation. Does µz = µxµy? Simulate with 100, 1000, 10000 and 100000 samples.
c) If z = x2, find the mean and variance of z by simulation. Does µz = µx2? Simulate with 100, 1000, 10000 and 100000 samples.
Question:
Many board games require the player to roll two dice. The number on each dice can vary from 1 to 6.
a) Use the rand function to combinations with a rounding function to create a user defined function which returns a simulation of one roll of a dice.
b) Use the function developed in a) to create a simulation which returns the value obtained by roll two dice.
c) Run the simulation 100 times, and determine the mean and standard deviation of the 100 simulations. Plot a histogram of the 100 roll results.
Question:
The analysis of breaking strength of a certain material shows that It is normally distributed with a mean of 250 kg, and a standard deviation of 4.3 kg.
a) Estimate the percentage of material samples that will have a breaking strength of at least 247 kg.
b) Estimate the percentage of material samples that will have a breaking strength less than 245 kg.
c) Estimate the percentage of material samples that will have a breaking strength with 3.5 kg of the mean breaking strength.
Question:
Consider a gas in a piston-cylinder device in which the temperature is held constant. As the volume of the device is changed, the pressure was measured. The volume and pressure measurements are given in the following table, for two different temperatures:
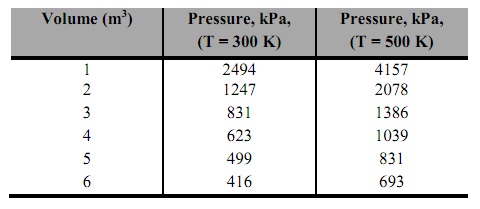
a) Use both linear and cubic spline interpolation to estimate the pressure when the volume is 3.8 m3 (T = 300 K).
b) Use both linear and cubic spline interpolation to estimate the volume when the pressure is measured as 1000 kPa (T = 300 K).
c) Use both linear and cubic spline interpolation to create an expanded volume-pressure table with volume increments every 0.2 m3 (T = 300 K). Create two graphs (one for linear values, one for cubic spline values) and plot the calculated values on the same graph with the measured data. Show the measured data as circles with no line, and the calculated values as a solid line.
d) Use the interp2 function and the data in the table to approximate a pressure value when the volume is 5.2 m3 and the temperature is 425 K.