Task 1: Draw graphs comprising algebraic, trigonometric and logarithmic data from a range of scientific and engineering sources, and find out realistic estimates for variables by using graphical estimation methods.
The voltage v across an inductor L, in LR electrical circuit drops exponentially over time t (s). The relationship is:
v = Ee-1/ τ
Where the emf, E, and τ are constants. Use the table of values for t and v and logarithms to plot an appropriate straight line graphs.
t 0.00 0.010 0.020 0.025 0.030 0.040 0.050
v 5.50 2.950 1.600 1.150 0.850 0.450 0.250
Use your graph to estimate the values of E and τ. How long did it takes to half the initial voltage?
Task 2: Make estimates and find out engineering parameters from graphs, diagrams, charts and data tables.
The given data are for cold-worked carbon steel tested in a tensile test:
Original diameter: 12.725 mm
Final diameter: 8.433 mm
Original gauge length: 50.8 mm
Final gauge length: 60.71 mm
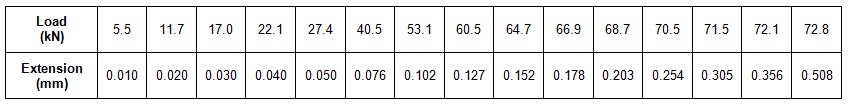
The maximum load was 74.3 kN. Plot the stress – strain graph and determine;
a) Realistic estimation of the modulus of elasticity.
b) Relationship between stress and strain.
Task 3: Find out the numerical integral of scientific and engineering functions.
Use the trapezium rule with eight strips to estimate the length of an ellipse circumference defined by:
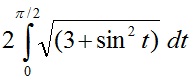
Repeat Task1 using Simpson’s rules.
Task 4: Estimate values for scientific and engineering functions by using iterative techniques.
Use the Newton-Raphson method correct to 4 d.p. to find the roots of the following equation.
t2 e3t = 25
Task 5: Represent force systems, motion parameters and wave forms as vectors and find out required engineering parameters using analytical and graphical methods.
A) An aircraft of top speed 340 km per hour sets a course to the north-east but, owing to the prevailing wind, its actual speed relative to the ground is 450 km per hour in a direction of 40o east of north. Using analytical and graphical methods:
a) Represent the aircraft motion as vectors.
b) Find out the direction and the speed of the winds.
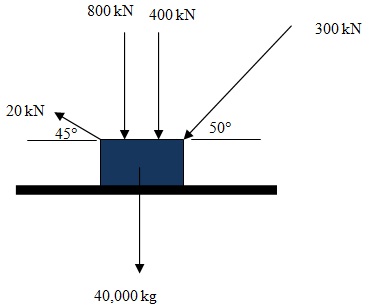
B) Find out the resultant force acting on the eyebolt shown in figure below as result of the four forces shown in the figure below, analytically and graphically. Compare and comment on the two results.
Task 6: Represent linear vector equations in matrix form and solve the system of linear equations by using Gaussian elimination.
Use Gaussian elimination; calculate the current, i1, i2, i3, in each branch of an electrical network that produced the following set of simultaneous equations
2i1 – i2 + i3 = -2
i1 + 2 i2 + 3 i3 = -1
2i1+ 2 i2 - i3 = 8
Task 7: Use vector geometry to model and solve appropriate engineering problems
A force of magnitude 3 unit’s acts at the point with coordinates (1, 2, 3). The force is applied in the direction of the vector. Find the moment of the force about O. Also find the moment of the force about the point with coordinate (1, 2, 3)