1) Use MATLAB and design following FIR filters. Plot their magnitude and phase responses. Plot their impulse and unit responses. On your HW answer sheet, draw out the filter block diagram.
a) High-pass filter, order=8, fs=20 kHz, cutoff frequency = 5KHz.
b) Band-stop filter, order 14, fs = 20 kHz, cutoff frequencies between 3 kHz to 5.5 kHz.
c) An 8th order, type 1, low-pass filter, a cutoff frequency of 8 Hz for a signal acquired using 64Hz sampling rate. Use the window method with a hamming window.
d) Filter to be applied to an ECG acquired at 240Hz sampling frequency. The filter must have a band-pass betweeen 0-40Hz and a stop-band 60-120Hz. The band-pass ripple is 6dB and the stop-band attenuation must be at least 20dB.
2)
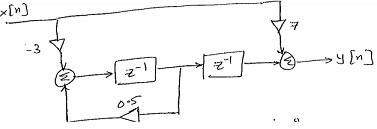
a) Write difference equation, transfer function. What type of filter is this?
b) If x(n) = [0, 0.1, 0.4, 0.5, 0.2], what is the output y(n) of the system?
c) What is the impulse response of the system?
d) Using MATLAB, generate frequency and phase responses.
3) If a linear system is described by: y[n] = 0.5*y[n-1]+x[n]-x[n-1], find the first 4 points of its impulse and step responses. (Hint: step response is the integral i.e. running sum, of the impulse.) Draw the pole-zero plot.
4) Draw the z-plane pole-zero plots for the filters:
a) H (z) = 1+2z-1=z-2/1-z-2
b) H(z) = 1+z-2/1+0.77z-2
Comment on the stability of each filter.
5) A second order filter has poles at ½ ± j ∗½∗ √3 and zeros at ±1. Find the difference equation (time domain description of the system). Find and plot the impulse response of the system.
6) What is the transfer function H(z) of a digital filter with the difference equation y(nT – 2T) = y(nT – T) + x(nT – T) + x(nT – 4T) + x(nT – 10T)? Where are the poles and zeros located? Do you think this filter is stable or unstable? How would you find the frequency response of this filter (don’t need to solve, just show the steps)? Now using MATLAB, make the frequency and phase plots. Use MATLAB to draw pole-zero plots.
7) A filter operating at a sampling frequency of 1000 samples/s has a pole at z = 1 and a zero at z = 2. What is the magnitude of its amplitude response at 500 Hz?
8) Draw the block diagram of a filter that has the difference equation:
y(nT) = y(nT – T) + y(nT – 2T) + x(nT) + x(nT – T)