You need to use Microsoft Excel for the tasks in the following Project.
Aims:
To analyse a set of data, and write a memo, identifying and explaining your insights into the operation of Todd Restaurants.
Learning Objectives:
In the process of this assessment task you will:
• learn to plan, schedule and execute project tasks with a view to improve your personal productivity;
• gain an understanding of some typical issues related to the operation of a medium size business;
• use the functionality of Microsoft Excel 2007/2010 to manipulate the sales and marketing data, analyse it and visualise it in tabular and chart form; and write a brief memo of your business observations and recommendations.
Case Background:
Todd Restaurants offer national chain of full-service, casual-themed restaurants in Australia. You have been offered the job of vice president of operations for Todd Restaurants. During your first week on the job, Joshua Todd, your boss and CEO of the company, has asked you to provide an analysis of how well the company’s restaurants are performing. Specifically, he would like to know which units and regions are performing extremely well, which are performing moderately well, and which are underperforming.
Assignment Instructions:
The CEO asks you to identify where to spend time and focus efforts to improve the overall health of the company.
1) Review the data that Joshua has provided you from the data warehouse in Data.Xlsx file. Rename the spreadsheet as: Lastname_Firstname.xlsx.
2) Use the Informationworksheet for your calculations and analysis to provide results for each of the following tasks:
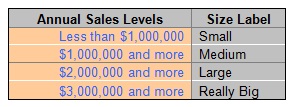
• Use ‘Restaurant Size by Sales’ column in ‘Information’ worksheet to categorize each restaurant size as ‘Small’, ‘Medium’, ‘Large’ or ‘Really Big’ according to their ‘Annual Store Sales’by using the following table. (You need to use VLOOKUP function for this; and the table needs to be stored in a new worksheet: ‘Size Table’)
• Calculate the number of years each restaurant is operating in the ‘Store Age (years)’ column. (you need to use a formula that calculates (‘Data Collection Date’ – ‘Store Opening Date’)/365))
• Calculate Total, Mean, Median, Maximum, Minimum, Range and Standard Deviation for all relevant columns, at the end of the data in the ‘Information’ worksheet.
3) Using the Information worksheet, Joshua needs to have a summary reportfor each region. The report should include the following:
a) Total Annual Sales
b) Total number of Seats
c) Average Annual Sales
d) Average Store Age (years)
e) Total number of Restaurants
f) Total number of advertising Restaurants
• Use the table in the ‘Summary Report’ worksheet for your calculations. For this report you should not use any Pivot Table analyses. Instead you need to use functions such as SUMIF, AVERAGEIF, COUNTIFS, etc…
• The report table needs to be sorted by ' Total Annual Sales’ column in descending order.
• All the cells in the report table need to be formatted appropriately.
4) Using the Information worksheet, Joshua also needs to have some analyses report for the following questions:
a) Which region has the highest ‘Annual Store Sales’ for ‘Really Big’ size restaurants
b) Which region has the lowest ‘Annual Store Sales’ for ‘Really Big’ size restaurants
c) What is the total number of seats for ‘Medium’ size restaurants in the highest ‘Annual Store Sales’ region?
d) What is the total number of seats for ‘Large’ size restaurants in the lowest ‘Annual Store Sales’ region?
e) What is the best annual sale restaurant at the worst region?
f) What is the worst annual sale restaurant at the best region?
g) What is the lowest age of the restaurant in the highest ‘Annual Store Sales’ region?
h) What is the highest age of the restaurant in the lowest ‘Annual Store Sales’ region?
• You should use Pivot Tables for these analyses. Provide your answers in the Solution Report worksheet using cell referencing to the results from your pivot tables.
• Create as many pivot tables as needed to show your results.
• You can include best and worst in the same pivot tables.
• Be sure to use filtering and/or sorting where needed to get exact results. For all worsts selling products be sure the amount is greater than 0.
• Make sure to show the results of your pivot table analysis by cells reference in the Solution Reportworksheet.
• For each question provide a chart with clear indication of the best/worst results. (You can show both best and worst in a same chart).
5) Prepare a Report in Microsoft Word that includes:
• An introduction
• The results from the Excel work sheet. You need to follow the exact questions sequence and copy and paste the necessary analyses (summary tables and graphs) from the excel file into the report.
• Discussion of your observations and recommendations. In your discussion include also which units and regions are performing extremely well, which are performing moderately well, and which are underperforming.