Refer to the given frequency distribution for Questions 1, 2, 3, and 4.
The frequency distribution below exhibits the distribution for suspended solid concentration (in ppm) in river water of 50 different waters collected.
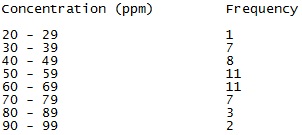
1) What percentage of the rivers had suspended solid concentration less than 40?
2) Compute the mean of this frequency distribution.
3) In what class interval should the median lie? Clarify your answer. (You don’t have to find the median)
4) Assume that the biggest observation in this dataset is 98. Assume this observation was incorrectly recorded as 988 rather than 98. Will the mean increase, decrease or remain similar? Will the median increase, decrease or remain the same? Describe your answers.
Refer to the given information for Questions 5 and 6.
A coin is flipped three times. Suppose A is the event that the outcome of the first flip is a heads. Assume B be the event which the outcomes of second and third flips are both tails.
5) Determine the probability which the outcomes of the second and third flips are both tails, given that the first one is a heads?
6) Are A and B independent? Why or why not?