SECTION – A
Question1)a) For the purpose of conducting a test of difference of two means, describethe levels of measurement for the variousvariables that are involved.
b) A retailer which sells home entertainment systems accumulated 10451 sales invoices during the previous year. The total of the sales amount on these invoices as claimed by the company is Rs. 63,84,675. In order to estimate the true total sales for last year, an independent auditor randomly selects 350 of the invoices and determines the actual sales amounts by contacting the purchasers. The mean and standard deviation of the 350 samples sales amounts are Rs.532 and standard deviation 168. Find the point and interval estimate given that a 95% confidence is required. Do you think that the amount of invoices claimed by the accounts department is correct?
Question2) FedEx and UPS are the world’s two leading cargo carriers by volume and revenue. According to the Airports Council International, the Memphis International Airport (FedEx) and Louisville International airport (UPS) are two of the ten largest cargo airports in the world. A sample of cargo handled in the two airport were recorded and based on the same can we conclude that there is a difference in the cargo handled by the two airports.
Memphis 9.1 15.1 8.8 10 7.5 10.5 8.3 9.1 6 5.8 12.1 9.3
Louisville 4.7 5.0 4.2 3.3 5.5 2.2 4.1 2.6 3.4 7.0 6.3 5.8
Use 5% level of significance to verify the above question.
SECTION – B
Mr. LePew, the advertising manager of a medium sized manufacturer of rug and room deodorizers, has developed three preliminary advertising campaigns for the company’s line of deodorizers. The three campaigns are tested in an independent sample of 24 cities across the US and the sales in each city are monitoried.( note: cities are randomly assigned to each campaign and cities are comparable in terms of various socioeconomic and demographic variables)
Sales in the cities
Adv 1 10 6 8 12 6 8 9 7
Adv 2 9 7 6 10 6 4 5 5
Adv 3 12 10 8 13 11 10 9 7
The data for the above were analyzed for basic descriptive statistics and the results are given below:
Table 1
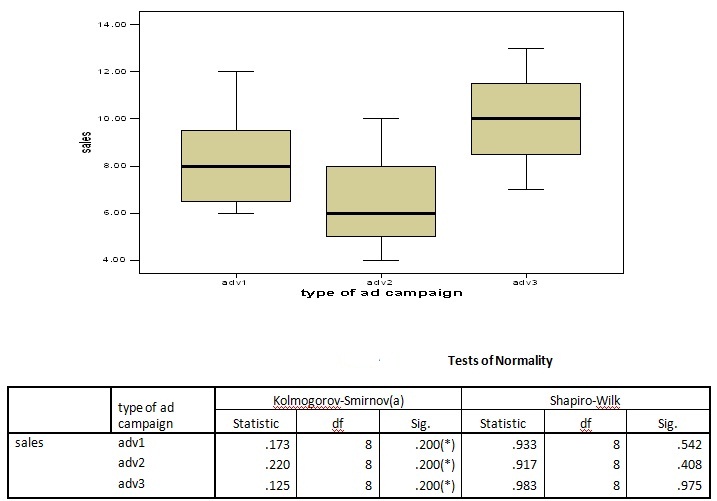
Table 2
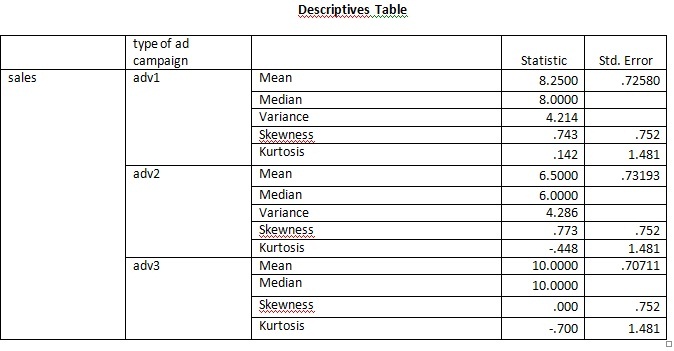
Table 3
Levene Statistic df1 df2 Sig.
.023 2 21 .978
Table 4
Multiple comparison
Dependent Variable: sales
Tukey HSD
(I) type of ad campaign (J) type of ad campaign Mean Difference (I-J) Std. Error Sig. 95% Confidence Interval
Lower Bound Upper Bound
adv1 adv2 1.75000 1.02062 .223 -.8225 4.3225
adv3 -1.75000 1.02062 .223 -4.3225 .8225
adv2 adv1 -1.75000 1.02062 .223 -4.3225 .8225
adv3 -3.50000(*) 1.02062 .007 -6.0725 -.9275
adv3 adv1 1.75000 1.02062 .223 -.8225 4.3225
adv2 3.50000(*) 1.02062 .007 .9275 6.0725
* The mean difference is significant at the .05 level.
Case Questions:
a) State the null and alternative hypothesis for the above problem.
b) Perform the suitable hypothesis at 5% level of significance. ( table value = 3.47)
c) State all the assumptions for carrying out the above test. Verify based on the output given in the question whether each of the assumptions are satisfied and justify your answer.
d) Based on the data given in fourth table as well as that obtained by you in part (b) above, interpret the complete result and state your recommendation.