Assignment
Answer the following questions:
1. The following table summarizes a data set with three attributes A, B. C and two class labels *, -. Build a two-level decision tree.
|
A
|
B
|
C
|
Number of Instances
|
|
-
|
+
|
|
T
|
T
|
T
|
5
|
0
|
|
F
|
T
|
T
|
0
|
10
|
|
T
|
F
|
T
|
10
|
0
|
|
F
|
F
|
T
|
0
|
5
|
|
T
|
T
|
F
|
0
|
10
|
|
F
|
T
|
F
|
25
|
0
|
|
T
|
F
|
F
|
10
|
0
|
|
F
|
F
|
F
|
0
|
25
|
a. According to the classification error rate, which attribute would be chosen as the first splitting attribute? For each attribute, show the contingency table and the gains in classification error rate.
b. Repeat for the two children of the root node.
c. How many instances are misclassified by the resulting decision tree?
d. Repeat parts (a), (b), and (c) using C as the splitting attribute.
e. Use the results in parts (c) and (d) to conclude about the greedy natureof the decision tree induction algorithm.
2. Classify the following attributes as binary, discrete, or continuous. Also classify them as qualitative (nominal or ordinal) or quantitative (interval or ratio). Some cases may have more than one interpretation, so briefly indicate your reasoning if you think there may be some ambiguity. Example: Age in years. Answer: Discrete, quantitative, ratio
a. Gender in terms of MorF.
b. Tempratureas measured by people's judgments.
c. Height as measured by people's height.
d. Body Mass Index (BMI) as an index of weight-for-height that is commonly used to classify underweight, overweight and obesity in adults.
e. States of matter are solid, liquid, and gas.
3. For the following vectors, x and y, calculate the indicated similarity or distance measures.
a. (a) x : (1,0,0,1), y : (2,1,1,2) cosine, correlation, Euclidean
b. (b) x : (1,1,0,0), y : (1,1,1,0) cosine, correlation, Euclidean, Jaccard
4. Construct a data cube from Fact Table. Is this a dense or sparse data cube? If it is sparse, identify the cells that are empty. The data cube is shown in Data Cube Table.
|
Fact Table
|
|
Product ID
|
Location ID
|
Number Sold
|
|
1
1
2
2
3
|
1
3
1
2
2
|
10
6
5
22
2
|
|
Data Cube Table
|
|
Product ID
|
Location ID
|
Number Sold
|
|
1
|
2
|
3
|
|
1
2
3
|
10
5
0
|
0
22
2
|
6
0
0
|
16
27
2
|
|
Total
|
15
|
24
|
6
|
45
|
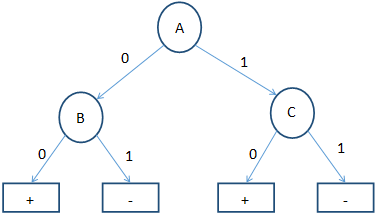
5. Consider the decision tree shown below:
a. Compute the generalization error rate of the tree using the optimisticapproach.
b. Compute the generalization error rate of the tree using the pessimistic approach. (For simplicity, use the strategy of adding a factor of 0.5 to each leaf node.)
c. Compute the generalization error rate of the tree using the validation set shown above. This approach is known as reduced error pruning.
|
Training:
|
| Instance |
A
|
B
|
C
|
Class
|
|
1
|
0
|
0
|
0
|
+
|
|
2
|
0
|
0
|
1
|
+
|
|
3
|
0
|
1
|
0
|
+
|
|
4
|
0
|
1
|
1
|
-
|
|
5
|
1
|
0
|
0
|
+
|
|
6
|
1
|
0
|
0
|
+
|
|
7
|
1
|
1
|
0
|
-
|
|
8
|
1
|
0
|
1
|
+
|
|
9
|
1
|
1
|
0
|
+
|
|
10
|
1
|
1
|
0
|
+
|
|
Validation:
|
|
Instance
|
A
|
B
|
C
|
Class
|
|
11
|
0
|
0
|
0
|
+
|
|
12
|
0
|
1
|
1
|
+
|
|
13
|
1
|
1
|
0
|
+
|
|
14
|
1
|
0
|
1
|
-
|
|
15
|
1
|
0
|
0
|
+
|
Format your assignment according to the following formatting requirements:
1. The answer should be typed, double spaced, using Times New Roman font (size 12), with one-inch margins on all sides.
2. The response also include a cover page containing the title of the assignment, the student's name, the course title, and the date. The cover page is not included in the required page length.
3. Also Include a reference page. The Citations and references should follow APA format. The reference page is not included in the required page length.