Question1) Simplify the following:
a. 16 ÷ 2[8–3(4–2)] + 1
b. 4–3[4–2(6–3)] ÷ 2
c. 16–3(8–3)2÷ 5
d. (3 + 4–6÷2 + 2) + ((9÷3 + 6x5)÷11) x ((4 + 5-6) + (18–3 x4))
b) Write the following numbers as a product of prime factors:
i) 56
ii) 270
c) Write the following numbers in index form:
i) 16 using base 2
ii) 81 using base 3
d) Simplify the following:
i) (7/2)-(8/3)/ (1/2 X 11/8)
ii) (7/4 X 2/3) / (3/5 - 5/4)
Question2) The following table shows the test results /scores for a group of students.
90 82 42 57
53 57 51 45
65 90 62 85
15 57 65 87
85 72 57 20
a) Calculate the
i) Mean
ii) Median
iii) Mode
b) What is the data range?
c) Compute the following using the data provided:
i) Lower quartile
ii) Upper quartile
iii) Interquartile range
d) Compute the standard deviation for the test scores.
Question3) The price of a jacket, inclusive of VAT, is R1026. Calculate the price exclusive of VAT. (Assume VAT of 14%.)
a) A retailer is selling a handbag which cost R 500 for R 620 in his shop. Calculate the percentage mark-up the retailer added. (Ignore VAT.)
b) At what price do I need to sell a leather couch with a cost price of R 4000, if I add a mark-up of 25%? (Ignore VAT.)
d) The marked price of an item, inclusive of VAT, is R855. Calculate the cost price if the mark-up is 20% of cost price.
e) The VAT payable on an item is R84. Calculate the cost price of the item if the mark-up on cost price is 20%.
f) A jacket costs R180 to make and a retailer adds 25% to get the selling price. During a sale, all goods are labelled “Sale price 10% of marked price”. How much did a customer pay for the jacket during the sale? What percentage profit did the retailer make on the jacket which was sold during the sale? (Ignore VAT.)
g) Mel’s Furniture shop bought a lamp that cost R100. To make Mel’s desired profit, he needs a 65% mark-up based on the selling price. What is Mel’s selling price and his rand mark-up? (Ignore VAT.)
Question4) Compute the amount you need to invest today, at 9% per annum, in order to have R10000 in 7 years’ time.
a) You have R15000 to invest for 5 years. If you can get 7% per annum on your investment, what amount will you have saved after 5 years?
b) Which of the following two options would you prefer if you can earn 11% per annum on your investment?
• Receiving R100000 now or
• Receiving R22000 per year for the next 5 years.
Question5) Which of the following [A-E] is the gradient of the line passing through the points (6,-5) and (-2, -11)
• 4/3
• 3/4
• 1/2
• 2/3
• 1/4
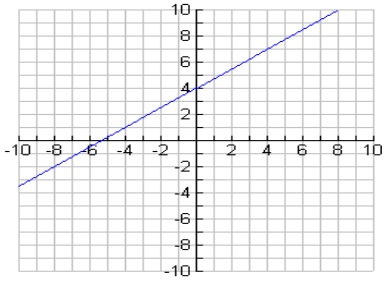
a) What is the equation[A-E] of the line whose graph is shown below?
[A] y-1 = ¾(x+4)
[B] y+7= ¾(x+4)
[C] y-7=4/3(x+4)
[D] y-1=4/3(x+4)
[E] y-7= -3/4(x+4)
b) Which of the following [A-E] is an equation for the line passing through (-4, 9) and (2, 6)?
[A] 2x+y-10=0
[B] 2x+3y-14=0
[C] x+2y-14=0
[D] x+2y-10=0
[E] x-2y-10=0
c) Which equation [A-E] has a slope of -3?
[A] x+3y=-12
[B] 3x-y=11
[C] 6x+2y=-7
[D] 9x-3y=0
[E] x-3y=15
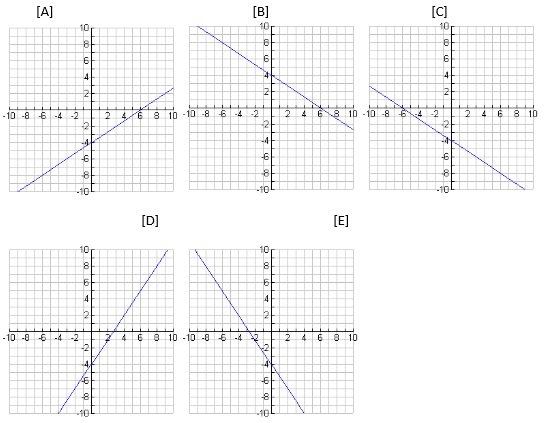
d) Which of the following [A-E] shows the graph of y=3/2x-4
e) A new swimming pool has opened in town. In the first week 740 people came to enjoy a swim. The records for the week show the four different age groups.
Day Child Student Adult Senior
Monday 25 22 19 17
Tuesday 27 20 20 18
Wednesday 26 23 17 19
Thursday 31 23 20 20
Friday 36 24 21 18
Saturday 59 35 31 24
Sunday 56 33 32 24
i) Draw the bar chart showing the total number of swimmers who used the pool on each day during the first week.
ii) Draw a pie chart to show the total number of swimmers in each age group who used the pool during the first week.
(Be sure to present your graph in the correct format including the correct titles etc.)