Easter Island is a small island (about 150 square miles in area) in the Pacific Ocean about 2,000 miles from South America. In about 400 AD there was a small population of settlers (say 24) on the island. The island was heavily forested. But the land was not very useful for farming, due to extremes in temperature and lack of fresh water streams. The only staples the settlers had were chickens and sweet potatoes that they brought with them from their previous location. There were not many fish around the island. There were, however, plenty of trees to support the various needs of the new population. These trees served as a natural resource from which huts and canoes could be built and a strong rope could be fashioned. Trees were also used as a fuel source for cooking and heating.
Since the society did not need to spend a lot of time on food production, much time went into social activities. The population began to divide itself into clans and created rituals that began to dominate their social structure. Part of the rituals involved the creation of stone statues. A competition between clans resulted in larger, more elaborate statues being sculpted. Soon trees were cut down to facilitate moving the statues from one location to another. The rope that was crafted, it is hypothesized, may have played a part in transporting some large stone statues from a volcanic rock quarry (near the volcano Rano Raruku) to other parts of the island, where they remain today.
The population flourished for a number of years, however by the 1600s there were almost no trees left on the island. By the 19th century there were almost no people left on the island. So what happened? Why after so many years did the population collapse? What happened to all the trees?
Your task is to create a system dynamic model to help you gain insight into what happened on Easter Island between 400 AD to 2000 AD.
The Diagram
A. The Population Structure
1. Set up a standard population model structure
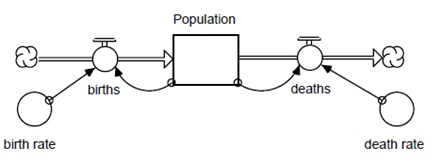
2. The population will begin with 24 people. We do not have actual data to support a birth rate, but we could calculate a reasonable birth rate from some assumptions. First, assume females comprised 50% of the population. Also, since people died at a much earlier age at that time we will assume that 75% of the females would have been of reproducing age. Finally, assume that there were 200 births per 1000 reproducing females per year. Calculate a value for the birth rate per year. Write the birth rate calculation and final value (round your answer to nearest thousandth). Be sure to include units.
3. What is the equation for births in the model Births =
4. What is the equation for deaths in the model Deaths =
5. Define these components in your model. We will not set the death rate yet. A graphical function will be used as part of the definition of death rate, and this graphical function will depend on some factors not yet discussed.
B. The Tree Structure
6. Now let's determine how to add the tree resource to the model. Use an initial figure of 50000 trees. For now we will consider trees to be a non-renewable resource, since the natives did not replant the trees they used. We want to keep track of the number of trees over time, so trees should be modelled by a Stock or a Flow?
7. Since trees are only decreasing, we need a flow that is into or out of the trees? Call this flow consumption. Add these two new components under the population section of your model.
C. Defining the Death Rate
8. As trees became less abundant the quality of life decreased. The natives began living in caves and had fewer canoes to use to search for fish. Reduction in food and resources led to increased conflicts between the clans. So, in addition to the natural death rate, the eventual reduction of trees would have caused the "real" death rate to increase.
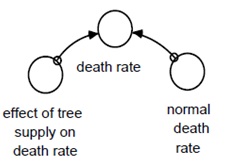
9. The "real" death rate is the product of two factors: the normal death rate (assume 70 deaths per 1000 people per year) and the effect of tree supply on death rate. The model segment should look like the one shown below.
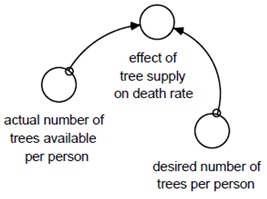
10. The effect of tree supply on death rate depends upon a ratio comparing the number of trees that are actually available per person per year to the desired number of trees per person per year. Create two new converters: first, actual number of trees available per person and second, desired number of trees per person (which you can set as 0.5). Connect these two new converters to the effect of tree supply on death rate. Double-click on effect of tree supply on death rate. Define the effect equation as actual number of trees available per person / desired number of trees per person (Notice that the units cancel.) Click Become Graphical Function. We want to define this effect of tree supply on death rate converter as a graphical function so the output value will change based on the ratio of the number of trees available over time.
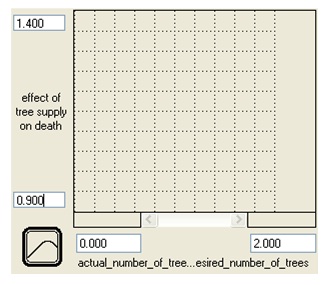
How do you think the number of trees affects the death rate? For example, what do you think happens to the death rate when there are plenty of trees (relative to what people need to survive)? What happens to the death rate if there are very few trees (relative to what people need to survive)? What if there are just enough trees? Draw your answer on the graph below.
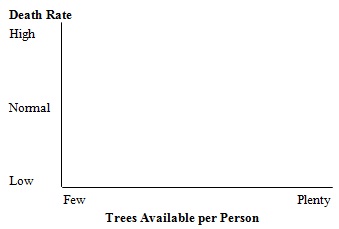
11. In the graphical function editor, set the number of data points to 11. Set the lower value of the horizontal axis to 0 and the upper value to 2. Set the vertical scale lower limit to 0.9 and the upper limit to 1.4. When there are lots of trees available we expect the normal death rate to be in effect. This will be the case as long as the actual number of trees is equal to or greater than the desired number of trees. So set the effect of tree supply on death rate output value to 1 for all points where the ratio (input) value is 1 or larger. When the actual number of trees decreases it begins to affect the death rate, slowly at first. When the (input) ratio is 0.8 the effect of tree supply will increase the death rate by 1.4% above normal (so set the effect of tree supply on death rate output value to 1.014). A (input) ratio of 0.6 causes the death rate to increase 4.5% above normal. At a ratio of 0.4 the death rate increases 8.5% above normal. At a ratio of 0.2 the death rate increases 15% above normal. And at 0 the death rate is 25% above normal.
On the grid below draw the graph that represents the effect of tree supply on death rate from the given information.
D. Connecting Population and Trees
12. As the population increases the consumption of trees will increase or decrease?
Draw a connection from population to consumption. (Make this connection a wide arc that swings around the outside of your model. It is better style not to have connection wires crossing each other.)
13. It makes sense that the consumption should be in trees per year, since it is a flow and all flows must be in “stock units” per “time.” Because the population is generating the consumption of trees, we will need to have population as part of the consumption flow definition. The other part of the definition involves how many trees each person is consuming each year. This is the component we still need to add. Actually we are going to define consumption per person per year using three converters. We will set up a structure similar to the death rate structure. Add three converters just above the consumption flow, one called normal tree consumption per person per year, another effect of tree supply on tree consumption per year, and the third actual tree consumption per person per year.
Connect both normal tree consumption per person per year and effect of tree supply on tree consumption per year to actual tree consumption per person per year. Define actual tree consumption per person per year as the product of the two converters upon which it depends. This structure (when it is complete) will allow the actual yearly consumption of trees per person to change over time based upon how many trees are left on the island. Are you remembering to put in units as you define converters?)
Connect actual tree consumption per person per year to consumption. Write the equation for calculating consumption (Remember: Consumption is how many trees all the people will consume each year.)
14. The normal tree consumption will be set to 0.025 trees per person per year. The effect of tree supply on tree consumption per year will be defined as a graphical function and will depend upon the ratio of the actual number of trees available per person and the desired number of trees per person. Connect both of these converters to the effect of tree supply on consumption per year. Double-click on the effect of tree supply on consumption per year converter. Set up the ratio and then click Become Graphical Function.
Set the number of data points to 11. The minimum ratio value will be set to 0 and the maximum value will be set to 2. Use the following table to define a graphical function for the effect of tree supply on consumption per year.
actual number of trees availableper person/ effect of tree supply on tree consumption per year
desired number of trees per person
0 0
0.2 0.063
0.4 0.125
0.6 0.25
0.8 0.5
1 1
1.2 2
1.4 4
1.6 8
1.8 16
2 32
15. There is one converter left to create. We need to determine the number of trees that are available per person. Create a converter called available trees per person. This converter depends upon the number of people and the number of trees on the island.
16. We have yet to define the actual number of trees available per person. If there are lots of trees available per person we want to allow people to use the desired number of trees per person. But if there are fewer trees available than the desired number we must limit each person to his/her apportioned share. To do this we will have the actual number of trees available per person depend upon the available trees per person and the desired number of trees per person. We will use a special command called MIN (for selecting the minimum value in a list of values). Define the actual number of trees available per person as MIN(available trees per person, desired number of trees per person) {trees/person/year}.
The Simulation
Define the time specification for the model to start at year 400 and end at year 2000. Set the DT to 0.25.
17(a). We are interested in looking at the graphs of population and trees. Define a graph pad to include each of these components. Set appropriate vertical scale values for each. To do this consider:
Trees will have a maximum value
Population could have a maximum value
(If you don't know the maximum value for population, run the simulation once and then check the maximum value for population in the graph pad.)
17(b). Set up a second graph pad to include population, birth rate, death rate, and actual number of trees available per person. Set the minimum y-scale for birth rate, death rate and actual number of trees available per person to 0 and the maximum to 0.5. (Note: If the scale for birth rate shows up as 0 or 1 for upper limit, double click on the birth rate name on the graph pad and select format 0.0. You will have to do the same for death rate and actual number of trees available per person before the change takes effect.)
Looking at the second graph printout, why do you think the population started to decline
18. Define a table to include trees and population components. How many years does it take the population to double? Is the doubling time the same for different time periods? Why or why not?
i) What was the largest value for the population?
ii) When did the population start to decline?
iii) How many people were left in 1900?
iv) How many trees were left in 1900?
19. What would happen if trees were being replanted at a rate of 100 per year starting in year 1700? (Actually this is somewhat unrealistic since new trees could not replace other trees immediately. It would take years of maturing before they would be harvestable. This is a something that we will put into the model later). Add tree replanting to the tree section of the model. Note: You will need to use the STEP function to set the rate of tree replanting (The function has the following format: STEP(amount, time to change)). Rerun the simulation.
Draw a feedback loop that relates the population with the number of trees (don’t forget to add polarity to the arrows in your feedback loop).
Explain what is happening to tree numbers and the human population with the replanting policy. Explain why the results make sense considering the feedback loop you drew above relating the human population with the number of trees
20. It is not reasonable to expect a tree that is planted one year to be of harvestable size by the next year. It would be necessary to wait a reasonable amount of time to allow the tree not only to grow to a useful size but also, because these were coconut palm trees, allow time for them to bear fruit. Add to the replanting model segment a delay that indicates the time trees take to mature (say 30 years) and that only mature trees are consumed. To do this we need to disaggregate the tree model structure (i.e., have more than one tree stock) into, say, saplings and mature trees.
With tree replanting and tree maturation added to the model:
i) How many people are now left in 1900?
ii) How many trees are now left in 1900?
21. Insert a picture of your completed model along with two model output graphs, (1) the first graph showing mature tree numbers and human population between 400 and 2000 AD without tree replanting, and (2) the second graph showing mature tree numbers and human population between 400 and 2000 AD with tree replanting.