Resource of supply curve
The resource probably to conform to the supply curve demonstrated in this figure would be: (1) housing. (2) capital. (3) labor. (4) land. (5) entrepreneurship. Can someone explain/help me with best solution about problem of Economics...
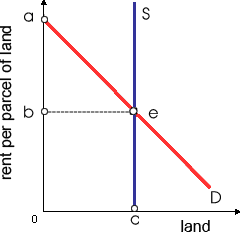
The resource probably to conform to the supply curve demonstrated in this figure would be: (1) housing. (2) capital. (3) labor. (4) land. (5) entrepreneurship.
Can someone explain/help me with best solution about problem of Economics...
Investments require: (w) current outlays, and yield current returns. (x) current outlays, and yield future returns. (y) future outlays, and yield current returns. (z) future outlays, and yield future returns. Pleas
What do you mean by globalization and its effects on the Indian economy?
Difference between increase in demand and increase in quantity: Whenever demand rises at specific price then it is termed as rise in demand?. On another hand, whenever demand increases by decrease in price of a com
Increases within market interest rates are probably to be related with: (1) people’s increasing desires for vast “nest eggs” for security while they retire. (2) bursting a speculative bubble into prices for hi-tech stocks. (3) increa
In below this demonstrated figure, there demand curve: (w) D0D0 is perfectly price-inelastic. (x) DD is perfectly price-elastic. (y) DD has a price elasticity coefficient of unity (1). (z) D0D0 has a price e
The marginal utility most obviously diminished whenever: (1) Eric sang six songs rather than only one on karaoke night at local club. (2) Molly’s piano lessons absorbed 20 hrs last week she could have used up for studying. (3) Karen built 12 boxes however only 9
A firm which realizes an economic profit in the short run will carry on generating economic profits in the long run only when: (i) it maximizes economic revenue. (ii) barriers to entry prevent entry from rival firms. (iii) its managers minimize princi
Refer to the following domestic production possibilities curve for Karalex. The gain to Karalex from specialization and international trade is represented by a move from: 1) A to B. 2) C to A. 3) C to D. 4) B to E. Q : Explain about minimum legal price A A minimum legal price is called a price: (1) floor. (2) guarantee. (3) foundation. (4) stabilizer. (5) subsidy. I need a good answer on the topic of Economic problems. Please give me your suggestion for the same by
A minimum legal price is called a price: (1) floor. (2) guarantee. (3) foundation. (4) stabilizer. (5) subsidy. I need a good answer on the topic of Economic problems. Please give me your suggestion for the same by
The baseball manager, whose players decline to bunt occasionally, rather always swinging for the homeruns, faces a: (i) Second-mover drawback. (ii) Prisoner’s dilemma. (iii) Principal-agent problem. (iv) Grim strategy. Can so
18,76,764
1930153 Asked
3,689
Active Tutors
1430323
Questions Answered
Start Excelling in your courses, Ask an Expert and get answers for your homework and assignments!!