Production Possibility Curve:
Similar to the individuals, a society as entire has restricted resources. It has to decide what to manufacture with restricted resource. It has to make selection about the quantity of various commodities. Selection emanates from scarcity. Therefore our choice is always constrained or restricted by scarcity of our resources. Assume we have adequate resources we can generate all that we wish for.
All these choices can be made with the help of production possibility curve. The production-possibility curve divides outcomes which are possible for the society to generate from those which can’t be formed subject to the accessible resources.
Let us assume an economy with so many industries, so many people, so much of electricity and natural resources in deciding what shall be formed and how such resources are to be assigned among thousands of various possible commodities. How many industries are to manufacture steel? How much electricity to be given for agriculture; how much for industries? Whether to give free electricity to farmer or not? These troubles are complicated. Hence, to simplify let us suppose there are only two goods to be generated - apples and oranges.
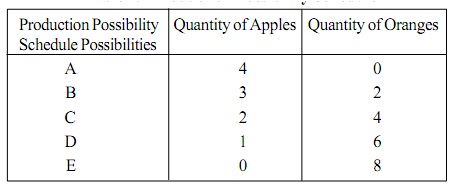
Table: Production Possibility Schedule
In above schedule A and E are possibilities where the economy either generates 100 % of apples or 100 % of oranges alone. However the production possibility curves supposes the production of two goods in various combinations. Possibilities A, B, C, D & E are such that the economy generates 4 units of apples and 0 units of oranges in possibility A, 3 units of apples & 2 units of orange in possibility B, 2 units of apples & 4 units of oranges in possibility C, 1 unit of apple & 6 units of oranges in possibility D, 0 unit of apples & 8 units of oranges in possibility E.
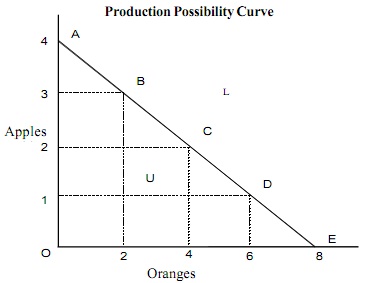
Figure: Production Possibility Curve
Therefore we see that when we are willing to have more of oranges, we must be willing to sacrifice more of apples. For illustration, to reach possibility C from B, the economy generates 2 units more of oranges by sacrificing 1 unit of apples. The full employment economy should always- in generating one good be giving up something of the other. This supposes of course, that at least some resources can be transmitted from one good to other.
Such selection of one specific alternative includes opportunity cost of foregoing the other. Therefore, the decisions of the society will depend on the comparison of costs and merits of each alternative. In doing so, both monetary and social cost and advantage should be the basis of any choice. Therefore the one which gives the maximum profit at minimum cost to the entire society must be the best option. We can picture the production possibility schedule by drawing a smooth curve (as shown in figure above).
Units of oranges are calculated horizontally and that of apples on vertical axis. The curve A and E depict the different possible combinations of the two goods - A, B, C, D, & E. Therefore a list of all possible combinations of apples &oranges makes up production possibilities. The production possibility curve is also termed as transformation curve or production possibility frontier. This curve exhibits the rate of transformation of one product to the other whenever the economy moves from one possibility point to another.
Every possible combinations lying on the production possibility curve exhibit the combinations of the two goods which can be formed by the existing resources. Any combination lying within the production curve like U in the figure points out that resource are not being fully utilized in the best-known manner. Any point outside the production possibility frontier, like L implies that the economy does not have sufficient resources to generate this combination. However a shift outside the production possibility frontier certainly points out economic development. This is possible by technological enhancement and raise in supply of factors of the production.