Output level on marginal revenue and marginal cost
When the firm produced at output level q2, this produced where: (w) MR = MC. (x) MR > MC. (y) MR < MC. (z) P < MC. Can someone explain/help me with best solution about problem of Economics...
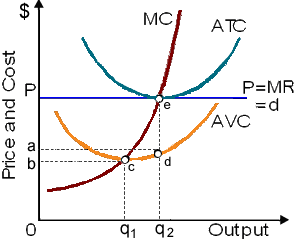
When the firm produced at output level q2, this produced where: (w) MR = MC. (x) MR > MC. (y) MR < MC. (z) P < MC.
Can someone explain/help me with best solution about problem of Economics...
Marginal revenue, which is: (w) the change in total revenue from selling an additional unit of output. (x) the change in total revenue from hiring an additional unit of labor. (y) computed as TR/Q. (z) specified by change in Q / change in TR.
Provide the solution of this question. The problem of asymmetric information is that: A) neither health care buyers nor providers are well-informed. B) health care providers are well-informed, but buyers are not. C) the outcomes of many complex medical procedures cannot be predicted. D) insurance co
Assume that you gain $36 worth of pleasure from first hole of the golf played on any specific day since you are an avid golfer, however the extra pleasure you profit from playing succeeding holes drops by $2 per additional hole. The $40 greens fee is needed to begin o
In this market for textbooks, demand has transferred from D0 to D1 and supply varied from S0 to S1. Such market for textbooks has experienced as: (w) a raise in demand and supply. (x) a redu
The demand for authentic leather footballs would tend to rise if: (1) Prices for football pads and cleats reduced. (2) Cheap footballs recently molded from the synthetic fibers demonstrated enhanced durability and performance. (3) Latest records were set for injuries
Marginal revenue is NOT: (i) similar as average revenue or price for a competitive firm. (ii) identical to the price of output for firms along with monopoly power. (iii) specified by (change in TR)/ (change into Q) for all firms. (iv) derived by the d
I have a problem in economics on Existence of Diseconomies. Please help me in the following question. Diseconomies of the scale exist if: (1) Price reduces as more units are sold. (2) Total costs reduction as output raise. (3) Average costs raise as output rises. (4)
Glynn s weekly income would be the highest at: (1) point a. (2) point b. (3) point c. (3) point d. (4) point e. Q : Profit Maximization in Labor Markets Can someone help me in finding out the right answer from the given options. All the profit maximizing organizations employ labor up to the point where: (1) MR MC is maximized. (2) VMP = MFC. (3) VMP = MRP. (4) MRP = MFC. (5) VMP = w.
Can someone help me in finding out the right answer from the given options. All the profit maximizing organizations employ labor up to the point where: (1) MR MC is maximized. (2) VMP = MFC. (3) VMP = MRP. (4) MRP = MFC. (5) VMP = w.
The demand for durable consumer good tends to rise if: (1) Supply rises. (2) Aggregate expenses rise. (3) Consumers predict price hikes or scarcities in the future. (3) Consumers predict surpluses in future. Choose the precise answ
18,76,764
1959011 Asked
3,689
Active Tutors
1440478
Questions Answered
Start Excelling in your courses, Ask an Expert and get answers for your homework and assignments!!