--%>

Illustration of teleporter market in equilibrium

The teleporter market would show a surplus when: (1) teleporter buttons were priced at P3. (2) Q2 teleporter buttons were produced and sold at a price of P2. (3) teleporter buttons were priced at P2. (4) Q3 teleporter buttons were produced and sold at a price of P3. (5) teleporter buttons were priced at P1.

378_Equilibrium for Buyers.png

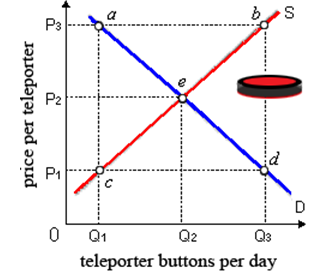
How can I solve my economics problem? Please suggest me the correct answer.

   Related Questions in Microeconomics

  • Q : Predation by charging a low price

    Predation by charging a low price is often a successful entry deterrent for all of the given reasons except the concept that low prices: (w) signal low profit. (x) make entry complicated while entry is costly. (y) may signal to a pote

  • Q : Market form-product distinguishing In

    In which market form, the products are distinguished. Answer: In Monopolistic competition

  • Q : Define Yield to Maturity Describe what

    Describe what do you mean by the term Yield to Maturity?

  • Q : Making error of omission Numerous big

    Numerous big publishing companies refused to publish a horror novel since the author was nameless. The author ultimately found a small publishing house to publish his book. The book sold millions of copies and produced hundreds of thousands of dollars in total revenue

  • Q : Investment in Equilibrium Investment is

    Investment is within equilibrium in all of the given cases EXCEPT while: (w) after adjusting for risk, maturity, and liquidity, all income producing assets yield identical returns. (x) all prices of assets exactly equal their respecti

  • Q : Pre-tax and pre transfer income

    From 1950, the pre-tax and pre transfer income distribution comprises: (w) become more equitably distributed. (x) remained about constant. (y) become less equitably distributed. (z) moderated because the rich and the poor both lost income to the middl

  • Q : Problem on substitution effect The

    The substitution effect is the modification in purchases of a good which outcome from a change only in: (1) Tastes and preferences. (2) Its associative price. (3) Real national income. (4) The wealth of consumer. P

  • Q : Annual total revenue of production When

    When Prohibition Corporation maximizes profit in its production of St. Valentine’s Day software, so annual total revenue of it will be around: (1) $140 million. (2) $250 million. (3) $320 million. (4) $420 million. (5) $1 billio

  • Q : Inelastic proportion of demand in

    This profit-maximizing firm in illustrated graph will never knowingly generate: (w) where MR is positive. (x) where MR is falling. (y) on the elastic proportion of the demand curve. (z) on the inelastic proportion of the demand curve.

    Q : Trends in Income Distribution The year

    The year in that a long-run trend towards greater equality within the U.S. income distribution was reversed, therefore income since then has become less equally distributed, it was roughly: (w) 1945. (x) 1960. (y) 1975. (z) 1990.

    Discover Q & A

    Leading Solution Library
    Avail More Than 1454635 Solved problems, classrooms assignments, textbook's solutions, for quick Downloads
    No hassle, Instant Access
    Start Discovering

    18,76,764

    1940800
    Asked

    3,689

    Active Tutors

    1454635

    Questions
    Answered

    Start Excelling in your courses, Ask an Expert and get answers for your homework and assignments!!

    Submit Assignment

    ©TutorsGlobe All rights reserved 2022-2023.