--%>

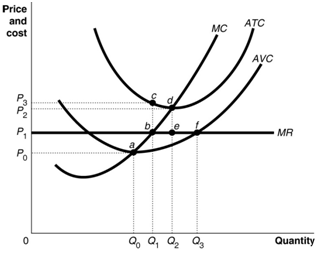
Illustrate profit or loss on the cost curve graph

A firm's total profit can be computed as all of the given except w) total revenue minus total cost. x) average profit per unit times quantity sold. y) (price minus average total cost) multiply with times quantity sold. z) marginal profit times quantity sold.
1545_Illustrating Profit or Loss on the Cost Curve Graph.png

How can I solve my economics problem? Please suggest me the correct answer.

   Related Questions in Managerial Economics

  • Q : Define the difference between

    Define the difference between accounting and economic cost.

  • Q : Explain about cartel in economics A

    A cartel is: (a) an oligopoly model which relies on interdependence. (b) an organization of oligopolist firms behaving like a monopoly. (c) an organization of firms that jointly make decisions. (d) All of the above.

    Q : Average rate of return in Human Capital

    This illustrated graph indicates that, there on average, rate of return to education is greatest for finishing the previous year of: (1) kindergarten, at point a. (2) grade school, at point b. (3) high school, at point c. (4) undergraduate college, at

  • Q : Labor Force Participation In the United

    In the United States throughout the past 70 years or therefore, the: (1) amount of human capital per worker has fallen. (2) labor force participation rate of women has risen. (3) supply of labor has consistently grown faster than the demand. (4) real rates of return f

  • Q : Policy of Avoiding Legal Liability The

    The expected losses to workers through shirking are increased while a firm adopts a policy of: (w) dividing productive tasks thus the division of labor is optimal. (x) paying efficiency wages which exceed market-clearing wages. (y) avoiding legal liability by not writ

  • Q : Employment Screening If job applicants

    If job applicants are asked for letters of recommendation and copies of their college transcripts, in that case a firm is practicing: (1) wage discrimination. (2) employment screening. (3) job signaling. (4) a structural employment system (5) credentialism.

  • Q : Linear supply curves and elasticity

    Along two supply curves which are straight lines by the origin, the price elasticity of supply as: (w) is below 1 for all prices and quantities upon both curves. (x) is less for a given quantity beside the steeper curve. (y) equals on

  • Q : Define the inelastic demand Define the

    Define the inelastic demand.

  • Q : Average Benefits in Human Capital and

    Throughout the past 50 years in the United States, there the average gains in lifetime income related along with having a college degree in addition to a high school diploma have: (1) declined since the larger proportion of the population that is college educated has

  • Q : Illustrates the conditions of price

    Illustrates the conditions of price discrimination?