Elimination of discrimination
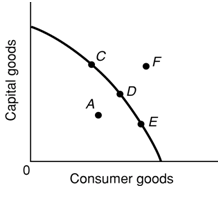
In the following diagram, the elimination of discrimination is best depicted by: 1) a move from C to E. 2) an inward shift of the production possibilities curve. 3) a move from A to D. 4) a move from E to C.
Transfer payments into the U.S.: (w) have little effect on income distribution. (x) are mainly received by wealthy families. (y) tend to reduce poverty. (z) eliminate the cause of poverty. Please choose the right a
Production within a competitive market system tends to be: (1) a process that exploits labor to the maximum. (2) geared to respond to the whims of central planners. (3) relatively efficient and low cost. (4) highly automated because labor costs more t
Assume that the demand and supply for a product can be described by the following equations:Q= 1200-4PQ= -200+2P Producing the product results in marginal external damage of $8 per unit.a. What type of
Which of the given demand curves have constant elasticities of demand as follows: (w) A vertical demand curve. (x) A horizontal demand curve. (y) A rectangular hyperbola. (z) All of the above. Hello guys I want you
Price hikes for DVD games will boost total revenue providing the price is: (w) located on this demand curve. (x) above $30. (y) below $30. (z) below $25. Q : Relationship between MPP and APP If MPP If MPP equivalent to APP, what will you state regarding APP? Answer: APP is at its maximum and steady or constant.
If MPP equivalent to APP, what will you state regarding APP? Answer: APP is at its maximum and steady or constant.
When all bonds are perpetuities which annually pay $1000 (the sum of one thousand and 00/100 dollars) per annum, at an interest rate of 10 percent, the price of these bonds is: (1) $4000. (2) $5000. (3) $6250. (4) $8000. (5) $10,000.<
You are more probable to shop at a remote farmers’ market quite than buy apples at a local grocery store while: (w) possible, since produce is cheaper at the farmers’ market. (x) you would like to buy only vegetables and fruits. (y) the opportunity costs o
Market demand curve: The market demand also rises with a fall in price and vice-versa. In figure below the quantity demanded by
If, after hiring the very last worker, the firm's profit is similar as it was before the last worker was hired, then the firm must: (1) Hire more workers to raise gain. (2) Layoff certain workers to raise the gain. (3) Not hire any more workers. (4) Shut down in short
18,76,764
1946040 Asked
3,689
Active Tutors
1420573
Questions Answered
Start Excelling in your courses, Ask an Expert and get answers for your homework and assignments!!