--%>

Economic profit in the short run by purely competitive firm

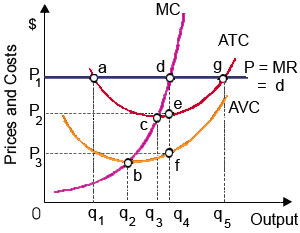
This illustrated graph is most consistent along with the environment confronted through a: (w) purely competitive firm which makes economic profit within the short run. (b) monopolistically-competitive firm into long run equilibrium. (c) firm along with oligopoly power which pursues a kinked-demand curve strategy. (d) pure monopoly which is capable to price discriminate.

2318_Total Revenue1.png

Please choose the right answer from above...I want your suggestion for the same.

   Related Questions in Microeconomics

  • Q : Least consistency for law of demand The

    The demand curve for socket sets from the list below which is least consistent along with the law of demand is: (w) demand curve D1D1. (x) demand curve D2D2.  (y) demand curve D3D3

  • Q : Generating good for the society All

    All along the production possibilities frontier, a society can generate more of a good merely if: (1) This provides some of some other good. (2) Resources are completely employed. (3) All resources are efficiently employed. (4) Consumption surpasses i

  • Q : Define Real Rate of Interest Define

    Define Real Rate of Interest in Economics?

  • Q : Greater economics loss than fixed costs

    Within the short run, there a monopolistically competitive firm will NOT operate at: (w) an economic loss that is less than fixed costs. (x) an economic loss that is greater than fixed costs. (y) making a normal profit. (z) making economic profits.

  • Q : Relative Income Measurement by

    The Department of the Census explains low relative income as experienced while families: (w) lack sufficient income to buy the fundamental food clothing and shelter required for survival. (x) would like to improve the

  • Q : Problem regarding Hicks Model of

    The time period of union strikes and the equilibrium wage rate at conclusion of the strike are focus at: (i) Dept. of Labor’s Collective Bargaining Arbitration Division. (ii) Collective bargaining model made by Sir John Hicks. (iii) Bilateral monopoly model.(iv)

  • Q : What demand curve illustrates What

    What demand curve illustrates?

  • Q : Define change in demand Change in

    Change in demand: When change in demand takes place due to change in factor other than price, it is termed as change in demand.

  • Q : Relative Income to Measures and

    From 1976 year, after adjusting income for taxes and transfers, the relative income group which, according to the Department of the Census, which has decreased most markedly like a percentage of the U.S. population ha

  • Q : Market power conduct by a price maker

    HoloIMAGine has patented a holographic technology which makes 3-D photography obtainable to consumers. The illustrated figure shows such that HoloIMAGine: (1) makes profit equal to area dcP0P3 since this can price discriminate perfectly. (2) has market power as a pric