--%>

Demonstrate supply curve for price elasticity of supply

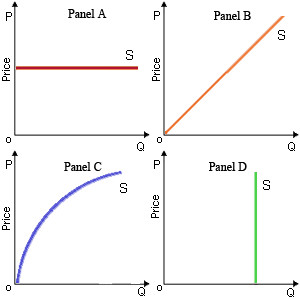
The quantity supplied is ever more sensitive as output increases, therefore the price elasticity of supply raises as the price raises for the supply curve demonstrated in: (w) Panel A. (x) Panel B. (y) Panel C. (z) Panel D.

241_Slope and Price Elasticity of Supply.png

Can anybody suggest me the proper explanation for given problem regarding Economics generally?

   Related Questions in Microeconomics

  • Q : Interaction of demand and supply with

    Identify and explain the main economic factors that determine the price of a good or service. Please include how demand and supply interact and elasticity, etc. Also give examples with graphs.

  • Q : Demand for labor by monopolist Can

    Can someone please help me in finding out the accurate answer from the following question. The demand for the labor by a monopolist in product market is its: (i) Value of the marginal product (or VMP) curve. (ii) Marginal revenue of product (or MRP) curve. (iii) Its m

  • Q : Private demands and supplies to assign

    Reliance on private demands and supplies to assign goods and resources is least certain to outcome an economically ineffective solution just because: (i) Producers encompass monopoly power. (ii) A good is non-rival and non-exclusive. (iii) Consumption

  • Q : Selling product below cost by predatory

    Nintendo Co. of Japan has been accused of discarding its products (as selling below cost) upon the U.S. market that harms U.S. producers. When true, it is an illustration of: (w) excessive international competition. (x) protectionism. (y) aggressive advertising. (z) p

  • Q : Percentage change in quantity demanded

    The percentage change within quantity demanded along this demonstrated linear demand curve is: (w) greater than the percentage change within price in range b. (x) smaller than the percentage change within price in range a. (y) precise

  • Q : Horizontal individual demand curves The

    The market demand curve is recognized by: (i) Vertically summing up individual demand curves. (ii) Graphing intersections of demand and supply over time. (iii) Holding quantity constant while summing up each price on demand curve. (iv) Horizontally summing up individu

  • Q : Value of Nonhuman Wealth The most

    The most unequally variable distributed for U.S. data would most likely be: (1) pre-tax and pre-transfer incomes 1929. (2) incomes after taxes and transfers 1975. (3) the value of nonhuman wealth 2005. (4) incomes after taxes and transfers 2005. (5) incomes before tax

  • Q : Pure competitors or perfect competitors

    The price makers in a purely competitive market are: (i) pure competitors or perfect competitors. (ii) producers of capital goods. (iii) pure oligopolies. (iv) monopolistic competitors.  (v) pure monopolies. H

  • Q : Output and experiences by long run

    This monopolistic competitor generates Q0 output and experiences: (1) only normal accounting profits, and zero economic profits. (2) positive economic profits. (3) high costs because of excessive managerial salaries. (4) stagnation because

  • Q : Profit-maximizing firm in oligopoly

    Relative to firms into other market structures, there a profit-maximizing firm in an oligopoly: (1) is more efficient than firms in a perfectly competitive structure. (2) produces a larger level of output than firms within any other m